

While the Biodiversity Gain Sites Register records off-site allocations, these are a small element of the whole BNG regime. The required biodiversity gain plans themselves — the information and documents that state, scheme by scheme, what the baseline biodiversity was and what biodiversity gain the development will deliver — sit dispersed across individual planning portals. Each portal is managed by one of over 300 hundred planning authorities and the information is not nationally collated.
So far, we’ve collected 263 of these biodiversity gain plans from 31 Local planning authorities (about 10% of authorities). We’ve audited them field by field against the published source documents. This is what they show.
How we created the dataset
Every gain plan here was found on a local planning authority’s portal as an approved application, with a published Biodiversity Gain Plan. To date, the earliest is dated 2022; 27 are from 2024, 129 from 2025 and 91 from 2026. The authorities range from Bristol, BaNES and East Suffolk, with 18 or 19 gain plans each, down to several with just one. Site areas, where a statutory metric calculation is published and the baseline habitat area can be read from it, run from a few hundred square metres to several hectares, with a median of 0.225 ha across the 133 gain plans that we have been able to locate so far.
The sample is not representative, and depended on our being able to locate gain plans on planning portals using a variety of search approaches. These searches did not always succeed and we have probably failed to identify all the approved gain plan applications on the portals we were able to interrogate.
How we found the documents
Collecting these 263 plans was harder than analysing them. Once the right application is found, the documents are usually easy to identify: they are labelled ‘Biodiversity Gain Plan’, ‘Net Gain’, ‘metric’ or something equally simple, and the labelling is broadly consistent between planning authorities. The real challenge is finding the application on the authority’s planning portal in the first place.
A gain plan must be submitted to discharge the statutory ‘deemed’ planning condition required under the BNG regime, so it sits within a related discharge application rather than within the original permission. Finding it means knowing which discharge application to look for, and under which application type (assuming there is one). Save for the regulations, there is no guidance on how the biodiversity gain condition should be discharged or what should be published when, so every authority has settled the question differently. A minority have a dedicated application type — e.g. ‘Approval of Details – BNG’ — and one search usually returns everything, but not always : on some planning portals this search returns nothing.
For example, the Bristol City Council planning portal Advanced search option returns no decided results when the ‘Discharge Deemed BNG Condition’ Application Type is used. Only two pending applications are found, but on closer examination, even though one contains the required Biodiversity Gain Plan document, there is no required statutory metric calculation, while the other one relates to an application that predates the BNG regime.
In all other cases the only method is to guess using search terms like ‘biodiversity’, ‘BNG’, ‘gain plan’, ‘net gain’, and hope this produces results. At one authority a search for ‘biodiversity’ returned 16 results, but fewer than half were gain plan applications. At another, three search terms yielded three plans, and we still don’t know whether that’s all of them.
The problem is not that the documents are concealed; it’s that there’s no reliable way to find them, and therefore no way to distinguish an authority with few gain plans from an authority whose search term we’ve not guessed correctly. We recently submitted 41 Freedom of Information requests asking for a list of biodiversity gain plan applications, but so far only one authority has given us the information we requested (Greenwich Borough Council). The others that have replied so far, such as North Somerset Council, have refused our request on the basis that ‘The information you have requested can be found on our Planning Portal’. We have asked for an Internal Review of these refusals.
There are two further obstacles: some plans are published as scans carrying no text layer, so they cannot be searched even once located, and in four decided cases from one authority the metric is published while the gain plan is not. This is not unusual.
The practical consequence is that a member of the public who wants to know how biodiversity net gain is being delivered, say on a development near them — and even when they know the original application reference — will in many cases still not find the answer. The regime may be ‘transparent’ as a matter of law but it is unsearchable as a matter of practice.
How developers deliver the gain plan
Question 4.6 of each gain plan asks the developer how it will reach the target percentage . Across the 263 gain plans we found these answers:
| 4.6 answer | Gain Plans |
| On-site | 142 |
| Both on and off site | 69 |
| Off-site | 43 |
| Both boxes ticked (contradictory) | 2 |
| Unanswered | 7 |
| Total | 263 |
So 112 gain plans — 43% — state that all or some part of the BNG required will be delivered away from the development site. That is a much higher rate of off-site reliance than the Biodiversity Gain Sites Register alone would suggest, because a development that delivers everything on site never appears on the register . The register can tell you where off-site provision is delivered, but not how often off-site provision is used, so it systematically understates it.
Is all the BNG required delivered?
The statutory requirement requires a minimum 10% BNG increase in area, hedgerows and watercourses habitats (it applies separately to each of these habitat modules). A scheme that adds, say, 30% of area units but fails to achieve at least a 10% increase in hedgerow units has not met the BNG requirement.
Taking area habitats, where 224 gain plans state figures we can analyse, the median net gain is +15.1%. That sounds sufficient, and for most schemes it is, but we’ve found that this value is not representative of the whole dataset. Twenty-seven gain plans record an area net gain below 10% on their own figures. Another ten record a negative area net change. These 37 developments, as described in each approved gain plan, in fact reduce each site’s area habitat units. The largest recorded loss is −62.7%.
There is also a long tail of very small sites recording enormous percentages: 18 gain plans exceed +100% BNG and two exceed +1,000%. These are almost all sites with a baseline close to zero — say a car park or a concrete garage base — where a handful of new planters produces a percentage gain that means very little. Any analysis that averages percentages rather than pooling units will be missed by them.
The hedgerow and watercourse modules are where the failures concentrate. Eighty-four gain plans state hedgerow figures; the median is +72.8%, but eight fall below 10%. Only 14 gain plans state watercourse figures at all — and of those 14, five fall below 10%, one of them negative. Watercourses are rare in this sample and poorly served when they appear, so it is hard to draw conclusions from this limited dataset.
Applying the test across all modules shows that 190 gain plans meet 10% everywhere, 35 do not, and 38 cannot be assessed based what the gain plan discloses.
Where do the off-site units go, and do they exist?
One hundred and four gain plans record post-intervention units at section 7.5 of the gain plan — that is, they state an off-site position in figures. Only 73 of those can be matched to an allocation on the Biodiversity Gain Sites Register, totalling 77.88 area habitat units.
The gap between those two numbers is the most consistently troubling thing in the dataset. It has several causes, and we have separated them in the register that accompanies this piece. Some gain plans record the whole habitat bank rather than the units allocated to the development, inflating the figure by a factor of ten or more. Some repeat their section 6 on-site figures in section 7, so the same units are counted twice. Some record a positive off-site uplift with no gain site reference at 7.2 and no allocation on the register at all. Twenty-seven gain plans fall into that last category — an off-site gain asserted in an approved document, with nothing on the statutory register to correspond to it. However, it may be that these sites have yet to purchase their offsite requirements.
The reverse case also occurs: 11 gain plans have units allocated on the register while the plan itself records no off-site gain.
Unit density: more habitat, no more biodiversity
Pooling the metrics we hold — 143 metrics covering 134.5 hectares of on-site area habitat — produces a finding that percentages conceal.
| Baseline | Post-development | |
| Habitat area (ha) | 134.53 | 138.25 |
| Biodiversity units | 424.65 | 424.97 |
| Units per hectare | 3.157 | 3.074 |
This table covers on-site area habitats only and excludes hedgerows and watercourses, which are linear habitats, and off-site purchases. It also predates the most recent additions to the dataset, so treat it as indicative of the 143 metrics we hold rather than of all 263 plans.
Across these sites, habitat area rises by 2.8% while total biodiversity units are flat, and unit density falls by 2.6%. The 10% gains recorded scheme by scheme do not aggregate into a 10% gain in on-site units, because a large share of the recorded gain is bought off site rather than created on it, and because what is created on site tends to be lower in distinctiveness and condition than what was there before. Greener, but with a lower habitat value.
What the documents show
Alongside the dataset, we maintain a register of defects — matters visible in the approved document itself, without site visits or ecological judgement. As of today it records 159 defects across 116 gain plans, from 263 held: a defect rate of 44% across 28 of the 31 authorities.
These are not close calls. They include gain plans dated before the survey they rely on; mandatory fields left blank; section 6 net-change figures that contradict the section 6.3 and 6.4 values above them; post-development values entered in the pre-development box; section 7 left empty on a gain plan that states the gain will be achieved partly off site. Every entry cites the figures it rests on, so any authority that thinks an entry is wrong can check it against its own document.
A distinct category is worth separating out. In four cases from one authority, a search of decided applications returned a statutory metric calculation but no biodiversity gain plan at all. At one of those sites the metric records the development losing 32% of the baseline area units. Off-site provision could in principle make that up — but the document that would say so, the gain plan, was not published. Under paragraph 13 of Schedule 7A, approval of the gain plan is the condition on which lawful commencement rests. It is the document that matters, and it’s the one that’s missing.
That case is worth dwelling on, because it’s the visibility problem meeting the compliance problem . A metric published without a gain plan is not a filing error. Under paragraph 13 of Schedule 7A the approved gain plan is the document on which lawful commencement depends, and it is the one document a reader cannot find. Whether it exists and was not published, or was never required, or was never produced, cannot be determined.
Why the numbers have fallen in our audit
Two months ago this analysis would have reported a defect rate of 49%. It reports 44% because we audited our own dataset before publishing it, and the audit removed findings rather than adding them.
Machine transcription fails silently. A field the extraction misses looks exactly like a field the applicant left blank, and a blank on our spreadsheet had been turning into a finding against a named authority. We compared 2,409 fields against the source documents and found 58 errors — a rate of 2.4% — of which the largest group were fields recorded as blank that were in fact fully answered.
The worst of it concerns tick boxes. Question 4.6 is a tick box, and so are 4.1, 4.7, 4.13 and 5.2. None of these PDFs stores its ticks as form data: the tick is drawn on the page, and every text extractor reports a ticked box and an empty one identically. A gain plan that answered the question looked exactly like a gain plan that ignored it. We had recorded 30 gain plans as leaving 4.6 blank and had made findings against 27 of them. Re-reading every box by measuring the ink inside it showed that all but one had answered. Thirty-one register entries were withdrawn.
We mention this because anyone building a dataset from these forms by text extraction has the same problem and may not know it. If your BNG data has tick-box fields in it, they are incorrect.
The full method, what was tested, what was found and what remains unverified, is set out in the audit statement published alongside the register. It includes the things we still cannot vouch for: only 4.6 was read in full across the whole set, and 11 of the gain plans are not on the Defra template at all, so questions cannot be said to be unanswered on them.
What this evidence fails to show
Six filters sit between this dataset and the population of approved gain plans in England:
- The authorities are self-selecting, being those whose portals expose gain plan applications in some sort of searchable form.
- The search of each portal may not have found every application.
- Only published documents can be tested.
- Fewer than half the gain plans have a metric published alongside them.
- Every filter removes cases at least as likely to be defective as those that remain.
The figures here should therefore be read as a floor on the rate of defects among approved biodiversity gain plans, not an estimate of it. A 44% defect rate among gain plans that were found, decided, published in full and then audited downward says nothing reassuring about the gain plans that were not found.
It is worth being explicit about what the first filter does. The authorities in this dataset are here because their portals let us find gain plans. That is not a neutral criterion. An authority that publishes its BNG documents in searchable, consistently named form is, on the face of it, an authority paying attention to the regime and the obligations it imposes. If anything, this dataset over-represents the diligent.
The dataset, the register and the audit statement are published in full below. In the meantime: we’d like to know which authorities do this well? If your portal makes gain plans easily findable, please tell us. Good practice is easier to copy than to invent.
How to fix this
Two things could make work like this unnecessary:
- National guidance from Defra and Ministry of Housing, Communities and Local Government on how the biodiversity gain condition should be discharged and what should be published — the sort of specification the LGA’s Planning Advisory Service could write if funded.
- A pre-submission checklist, ideally endorsed by CIEEM, covering the handful of errors that account for most of what we found.
Neither of these solutions would be difficult and both would do more for biodiversity net gain than yet another round of metric revisions. They might also, perhaps, make the life of the poor, beleaguered planning officer a lot easier!
The full dataset (263 gain plans, 31 authorities), the non-compliance register, the BGP Full Data Extract spreadsheet and the audit statement are available via the link below. The register details every defect found, with the figures it rests on.
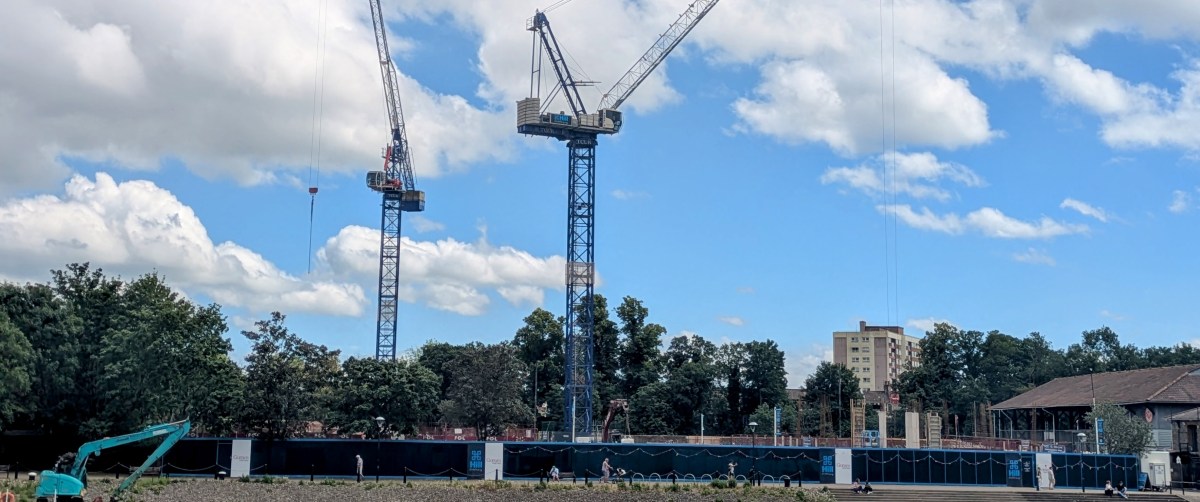
The cover image shows the development at Baltic Wharf which was located on the Floating Harbour in Bristol — a former caravan park that has lost 78 well-established mature trees to make way for the development.
 Bristol Tree Forum