When a city builds, where does nature go?

Since February 2024, developers in England have had a legal duty to improve the biodiversity of their development site by at least 10%. This Biodiversity Net Gain — BNG — is calculated in ‘habitat units’ using a government spreadsheet. If a scheme cannot achieve this gain on the land it’s actually building on, it can buy the shortfall from a habitat bank anywhere else in England.

The BGS register

The public register of these off-site purchases is called the Biodiversity Gain Sites (BGS) register. It lists both the authority where a development sits and the authority where the compensating habitat is purchased.

We looked at all 2,441 allocations on the register, covering 301 local planning authorities. We found that, across the board, 79% of the allocations send the compensation to a local authority far from the development itself. That is striking enough. But the pattern sharpens dramatically in the more urban areas.

For example, in London, 98% of allocations are delivered outside the borough where the building happens. Just 3% stays within it. London’s boroughs have generated external demand for 46 habitat units and host barely three in return. Metropolitan districts — such as Manchester, Sheffield, Leeds and Birmingham — send 88% of their compensation elsewhere.

By contrast, non-urban authorities send 74%, and keep habitat within their own boundaries in 42% of cases, against London’s 3%.

Taken together, urban authorities are net exporters of habitat. The countryside is where it lands – often in remote rural locations few will ever visit.

How far away does nature go?

The register also records the distance between each development and the habitat bought to compensate for it. The typical distance is 37 km — roughly 23 miles. One allocation in five is more than 100 km away from its development site.
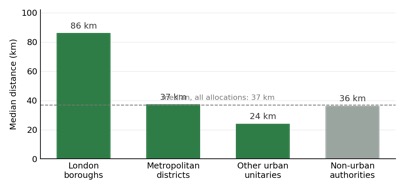
Median distance from development to compensating habitat, by type of authority

For London the median is 86 km, and nearly half of the capital’s allocations are more than 100 km away. Two-thirds fall into the register’s most distant category — the same category the rules are meant to discourage.

Who loses out?

Each site can be placed on a national deprivation scale, from decile 1 (the most deprived tenth of neighbourhoods) to decile 10 (the least deprived). Comparing where a development happens with where its habitat ends up gives a rather uncomfortable picture.
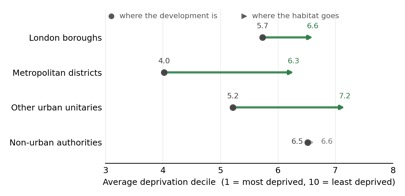
Average deprivation decile of the development, and of the habitat created to compensate for it

Development in metropolitan districts sits, on average, in decile 4.0 — among the more deprived parts of England. The habitat created to compensate for it sits in decile 6.3. Nationally, the shift is from 6.0 to 6.6, and it is almost entirely driven by cities.

Of the 504 allocations where the development is in one of the three most deprived deciles, 99% send their habitat somewhere less deprived — landing, on average, in decile 6.5. For non-urban authorities there is essentially no movement at all.

Displacement, not disappearance — but that is not the whole story

It is worth being careful here. Habitat units are being created. This is displacement, not straightforward destruction, and the register shows real habitat banks being funded and monitored.

Nor is this purely an urban phenomenon. The largest single net exporters on the register are Cherwell in Oxfordshire and Westmorland and Furness — not cities, but high-growth areas under development pressure. Land scarcity, not city status, is the underlying driver.

But displacement still matters, for reasons the metric does not capture. A hectare of habitat in a dense neighbourhood serves thousands of people who can visit it, but the same hectare 50 miles away, on a farm almost nobody visits, scores identically in the register. Access, shade, cooling, birdsong on the way to school — none of these elements appear in the data.

The rules do include a brake: compensation delivered further away is discounted, by a quarter if it’s in a neighbouring area and by half if it’s farther still. On this evidence, though, the brake is not holding, and the latest plans propose to remove it altogether for many developments, making it still worth buying habitat miles away.

What the gain plans show

We also read 205 individual gain plans in detail. The contrast is just as clear on the ground.

Developments in urban authorities lost area habitat on site — down 8% overall between the ‘before’ and ‘after’ figures in their own calculations — while developments in rural authorities gained 16%. Yet both groups have to demonstrate the same 10% or more net gain. Urban schemes get there by buying it: 54% of them use off-site compensation, against 33% elsewhere. Often this is simply because there are just no local Biodiversity Gain Sites, so the developer has no local options.

This is not a story about small development sites. The average development we measured was almost exactly the same size in urban and rural authorities — around 0.7 hectares. It is about the scarcity of available urban land, which is reflected in its cost, not the size of the plots.

The question worth asking

BNG is a real advance on what came before, and the register is a genuine piece of public transparency. This analysis is only possible because the data is published.

But if the policy’s promise is that development leaves nature better off, it is fair to ask: better off for whom? On current evidence, the answer in our biggest cities is someone else, somewhere else — on average 37 kilometres away, in a less deprived place.

Here is our detailed analysis:

Where does the biodiversity go?


Analysis by Bristol Tree Forum, using the Biodiversity Gain Sites register (2,441 allocations to 28 July 2026) and 205 biodiversity gain plans transcribed from local planning authority records. Charts and underlying data at bgs.bristoltrees.space.
Ancient trees, missing data, and the fight over Bristol Airport’s planned expansion

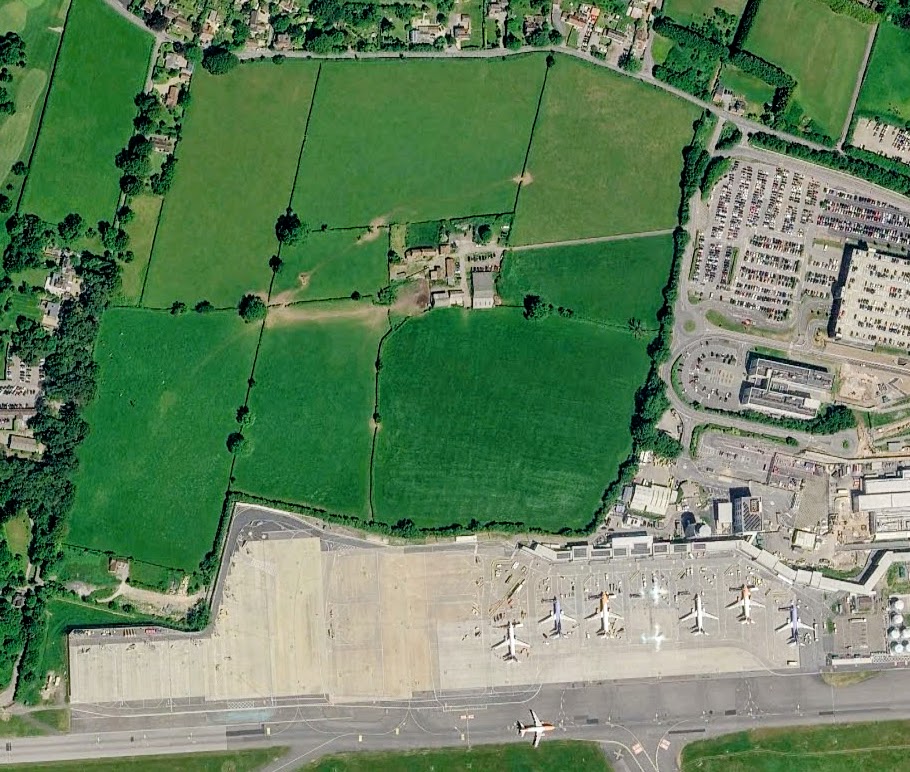
So far, most of the public alarm about this expansion has centred on Felton Common, the well-loved local nature reserve on the other side of the runway, where the airport wants to plant 8.5-metre approach lights and fencing across protected grassland. Campaigners under the Save Felton Common banner have campaigned hard against that ‘land grab’, and rightly so. But the fierce fight over the Common has largely overshadowed a second, quieter yet important threat next door — the loss of irreplaceable habitat at Cook’s Farm, which has drawn far less attention. That is what our objection is chiefly concerned with.

Bristol Airport wants to grow. Its planning application (ref. 26/P/0686/OU2) seeks permission to expand from 12 million passengers a year to 15 million. To do this, the airport needs more land — including Cook’s Farm, some 24 hectares of long-established agricultural countryside where hedgerows have stood since at least the 1840s and where some trees have been growing for centuries. The airport now proposes to compulsorily purchase the site so it can carry out its plans.

However, it first needs to persuade the planners that its proposal is acceptable. We say it’s not, and we’ve lodged a detailed objection. It is a technical document, full of hectares and habitat codes, but underneath the detail is a simple story: irreplaceable habitat is at risk, the evidence supporting the plans doesn’t add up, and the law says that should matter.

Here is what our objection says, in plain terms.

The heart of it: three veteran trees

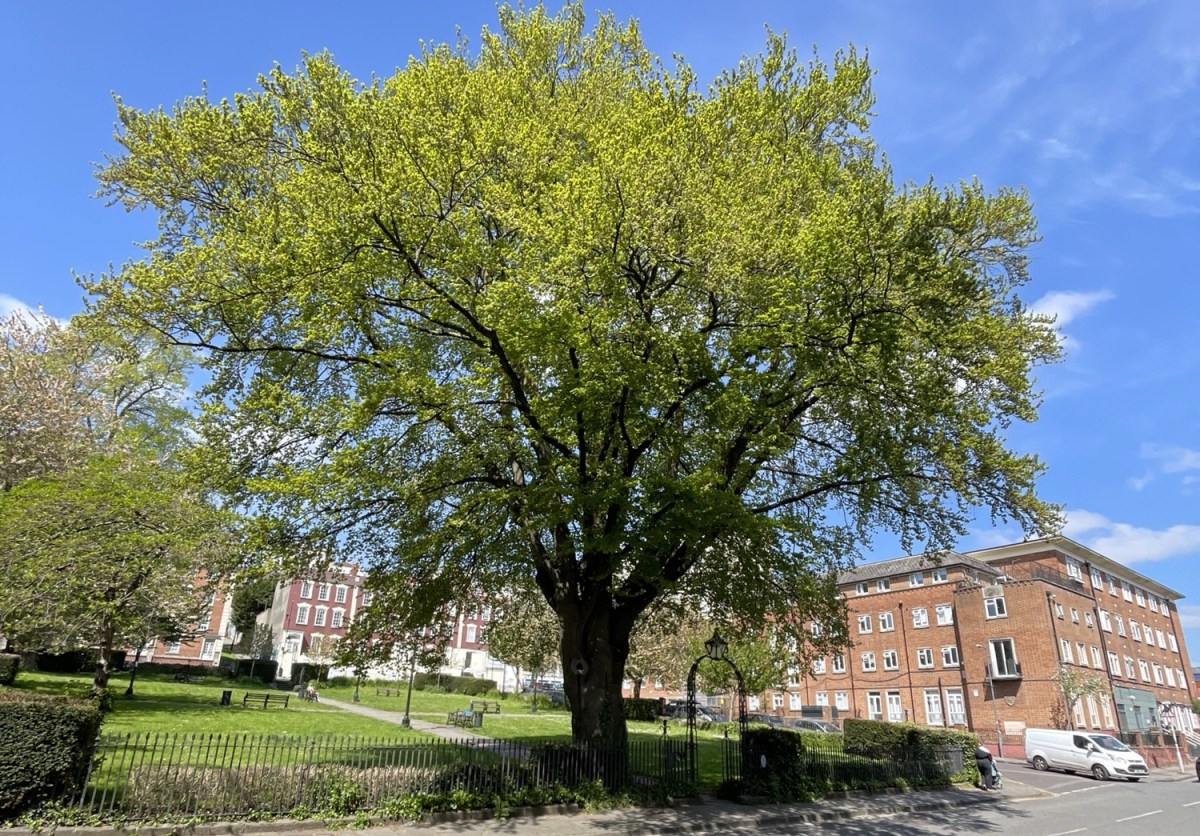
The most emotive part of the case concerns three veteran trees growing in an ancient hedgerow on the boundary of Cook’s Farm — two Ash and one Sycamore. The airport doesn’t propose to simply cut them down. Instead, it plans to translocate them: lift them with a giant tree spade and replant them on the northern edge of the development.

That might sound like a reasonable compromise, but our objections explain why it’s not in careful detail.

A veteran tree isn’t just an old tree, especially those in long-established hedgerows. It’s a whole ecosystem — cavities, rot, deadwood and fungal growth that specialist insects, fungi and other wildlife depend on and cannot find anywhere else. These features take centuries to form. You cannot manufacture them, and you cannot move them.

Worse, veteran trees are extremely unlikely to survive being moved. Their biology works against them. Over centuries they’ve spent their reserves coping with drought, storms, disease and damage, leaving little in the tank to survive the shock of relocation. Their roots are extensive but fragile, they depend on specialised underground fungal networks built up over generations, and much of their internal wood is effectively dead but structurally essential — it can’t be repaired if damaged. Successful relocation needs around two full growing seasons of careful root preparation beforehand. Crucially, the airport’s plan makes no proposal to reduce the trees’ roots at all. As our objection bluntly puts it: if the trees are translocated without root reduction, they will die.

Our conclusion is that, for the purposes of a planning decision, these three veteran trees should be treated as lost. The airport itself seems to half-accept this: it promises a ‘compensation’ package of ten new future veteran trees and the artificial ‘veteranisation’ of ten existing trees. But you can’t conjure a veteran tree on demand. Even with the right conditions, it takes two or three decades for a ‘veteranised’ tree to start resembling the real thing — and it will still lack the fungal decay that gives a true veteran its ecological value.

The evidence doesn’t add up

Beyond the trees themselves, we found that the environmental evidence supporting the application is riddled with inconsistencies. This means that the application can’t properly be decided as it stands.

The airport is required to demonstrate that it will deliver ‘Biodiversity Net Gain’ — a calculation meant to prove development leaves nature in a measurably better state (at least 10%) than it was before development. But our objection shows the numbers in the official metric calculation simply don’t match the airport’s own ecological survey. The two documents use different habitat categories, different reference codes, and don’t cross-reference each other. Some habitats that appear in the survey are missing from the metric altogether. Habitat parcels aren’t sized, and their locations aren’t shown on the map. In short, it’s impossible to reconcile the airport’s own datasets.

The tree surveys are a particular problem. Three surveys tucked into the appendices fail to meet BS5837:2012, the British Standard for trees in planning. Between them they’re missing the surveyors’ names and qualifications, survey dates, crown-spread data, branch heights and directions, life-expectancy estimates, soil assessments, and even the number of trees in some groups. One key survey dates from June 2024 and is now out of date. And when we asked for the tree schedule in a usable spreadsheet format so we could check it, our request was refused — leaving them, in their words, to analyse the data ‘as best we can’.

Even working with that inadequate evidence, their interim analysis is striking. Of roughly 1,618 individual trees on the site, some 367 — more than a fifth — are set to be removed, along with a share of the site’s hedgerows, which the airport’s own figures and the survey record in wildly different numbers (10 hedgerow parcels in one document, 71 in another).

Why this is a matter of law, not just sentiment

This is where our objection turns from ecology to policy — and it’s the part that could decide the outcome.

National planning rules are clear about irreplaceable habitats. Paragraph 193(c) of the National Planning Policy Framework says development that causes the loss or deterioration of irreplaceable habitats — and it names ancient and veteran trees specifically — ‘should be refused, unless there are wholly exceptional reasons and a suitable compensation strategy exists’.

We make two arguments about this test:

  • First, it’s a two-part test that has to be met in sequence: you need both wholly exceptional reasons and a suitable compensation strategy. A compensation package — however good, and here they say it isn’t good — cannot on its own make the reasons ‘wholly exceptional’. The decision in Juden v London Borough of Tower Hamlets [2021] EWHC 1368 (Admin) backs this interpretation.
  • Second, we argue that this scheme doesn’t clear the ‘wholly exceptional’ bar at all. The Framework’s own example of exceptional reasons is nationally significant infrastructure — the kind of once-in-a-generation project decided by government. This application, we say, is simply about increasing the capacity of an existing airport. That’s not the sort of wholly exceptional circumstance the rules have in mind.

Our objection also points to local policy. North Somerset Council’s own adopted Core Strategy (Policy CS4) requires it to protect, connect and enhance important habitats, ‘particularly designated sites, ancient woodlands and veteran trees’. The same protection is included in the Council’s emerging 2041 Local Plan. Approving the loss of these veteran trees would go against the Council’s own rules.

What it comes down to

Strip away the appendices and the acronyms, and our case is straightforward. The airport wants to expand on to land that includes centuries-old, irreplaceable habitat. Its plan to ‘move’ three veteran trees is, on the evidence, a plan to kill them slowly. The paperwork meant to justify all this is inconsistent, incomplete and in places non-compliant with the relevant standards. National and local planning policy both say irreplaceable habitat like this should be protected, not traded away for extra passenger numbers.

Our central demand is modest but firm: these problems need to be resolved before the application can properly be decided. For anyone who cares about Cook’s Farm, its ancient hedgerows and the veteran trees growing in them, that’s the line worth holding.

Here is our full response to the application:

BTF Consolidated Comments – 06 May 2026

Why trees keep drawing the short straw in the new nature rules

We’ve written before about the rule change that, from 6 August 2026, lets the smallest building sites skip the ‘leave nature better off’ requirement. But that small-sites exemption is only one of several changes on the way to the same set of nature rules. Taken together, they keep landing on the same casualty: the everyday trees growing on our streets, and in our parks and gardens.

Here is why trees, in particular, keep losing out.

Trees are the odd one out

Most habitats the BNG rules deal with — grassland, scrub, hedgerows etc. — can, in principle, be recreated somewhere else within a few years.

Plant a replacement tree for one felled and it starts life as a sapling and will take (assuming it lives long enough) years to do what the felled tree was already doing: a mature tree takes decades to mature and at least nine saplings to replace just one. The largest trees would need at least 19 new trees and still take many years to ‘replace’.

And a tree’s real value — the shade and cleaner air it provides us, soaking up rainfall, its character and the nature it shelters that you see daily — is delivered exactly where it stands. Move the ‘replacement’ to a distant field few will ever visit and, while you may have ‘ticked the replacement box’, you have lost the thing that mattered – your local, everyday tree.

That is the backdrop to the changes now coming.

Clearing trees here, ‘making up for it’ miles away

For slightly larger sites, one proposal would let developers skip trying to keep trees on the site and instead allow them to pay for replacement habitat (not necessarily trees) somewhere else — potentially a long way off. The mature tree that was growing near you, ‘replaced’ by a patch of new grassland or scrub far away in some ‘foreign field’ you cannot visit. The paperwork balances but your tree is gone.

A much bigger exemption for brownfield sites

This could be the big one for towns and cities. The Government has floated exempting brownfield sites of up to 2.5 hectares — more than ten times the size of the small-sites limit. Brownfield and urban plots are exactly where many mature street trees grow, so an exemption on that scale could wave through a lot of tree loss. It is still just a proposal and a final decision is awaited, but the threat is real.

‘Temporary’ felling that lasts forever

Another idea would exempt “temporary” development — anything that can put back within five years. That may be fine for many habitats, but not for trees: you cannot regrow a mature tree in five years. Fell it for a short-term purpose and it is gone for good.

Trees removed in the name of nature

One proposed exemption covers work to improve parks, playing fields and public gardens, or projects whose main aim is to help wildlife. Well meant — but these are often the places where big, mature trees grow. If the ‘improvement’ means cutting trees down — for example, to create open grassland or a play space — there would be no obligation to plant replacements.

Why it adds up

On their own, each of these is a small technical tweak. Together, they push in one direction: it becomes easier to remove the trees closest to where people live, and to offset them — if at all — with habitat elsewhere. The result, over time, is fewer trees in our neighbourhoods and the inevitable ‘greying’ of our urban spaces.

The older protections for trees still stand — Tree Preservation Orders, conservation-area rules, and protection for ancient and veteran trees — along with any local tree protection policies your council has adopted, but these are not always fully applied. Even so, this is exactly why these protections will matter more than ever.


Read the full briefing note here

Our earlier companion post is also available here – The small-sites rule change that could quietly cost your neighbourhood its trees

The small-sites rule change that could quietly cost your neighbourhood its trees

From 6 August 2026, a change to the planning rules takes effect that most people will never hear about — but it could reshape the trees on our streets, in our gardens and on the small plots being built on all over the country.

Here is the short version.

What is changing

When land is developed, the law has, since 2024, usually required a small boost to nature — a “Biodiversity Net Gain” of at least 10%. In plain terms, a development is meant to leave nature a little better off than it found it.

From 6 August, the smallest sites — those of 0.2 hectares or less (about 2,000 square metres, roughly a third of a football pitch, or a small cluster of houses and their gardens) — no longer have to do this at all.

For hard-pressed small builders, that is a welcome simplification. But there is a catch for trees.

Why trees are caught in the middle

Under the old rules, removing even a single tree was usually enough to bring a small project into the nature-boost system — because of the way a tree’s protected “footprint” is measured. In practice, that meant a developer could not quietly fell a tree on a small plot without having to make good the loss.

The new rule swaps that “what is the impact?” test for a much simpler “how big is the site?” test. If the site is 0.2 hectares or smaller, the nature rules simply do not apply — however many trees are cleared.

What that means on the ground

On a site right at the new limit, the equivalent of up to 48 small trees — or around a dozen mature ones — could be removed with no requirement to replace or compensate for them under this system. And the trees most exposed are exactly the ones we tend to notice most: established trees on small urban and infill plots.

What still protects trees

It is not a free-for-all. Tree Preservation Orders, conservation-area rules and the special protections for ancient and veteran trees all still apply — they sit entirely outside this change. Some councils also have their own local tree policies: Bristol’s Tree Replacement Standard, for example, still requires replacement planting whatever the new exemption says.

The snag is that these local protections only exist where a council has actually put them in place — and not every council has.

Why it matters

The change is a sensible piece of red-tape reduction for small builders. But it is also, almost by accident, a real step back for the everyday trees that give our neighbourhoods shade, character and wildlife. From August, whether the trees near you are protected will depend less on national nature rules and more on whether your council has its own policies — and on whether a particular tree happens to be covered by an order.

If you value the trees around you, it is worth asking your local council what protections are in place.


We have set out the full detail — the mechanics, the legal position, and what to watch next — in an accompanying briefing note.

Read the full briefing note here.

St Philip’s Marsh: do the green space sums add up?

Bristol’s biggest regeneration plan promises parks within a five-minute walk of every front door. We measured the plan’s own drawings to see whether the promise holds. Here’s what we found.

St Philip’s Marsh is about to become the new place in Bristol to live, work and study. The draft Masterplan, created by the Bristol Temple Quarter Partnership is now out for consultation. It proposes at least 7,000 homes — for roughly 15,000 people — on 94 hectares of old industrial land east of Temple Meads, plus workspace for thousands of jobs and student housing beside the university’s new campus. For an area with almost no publicly accessible green space currently, the Masterplan’s vision of parks, green streets and riverside walks is most welcome, and we want it to succeed.

However, when we measured the plan’s own drawings — every park, square and green corridor, checked against the Council’s own GIS records — the numbers put forward started to wobble.


A table that vanished

The Masterplan’s headline is 22.4 hectares of open space and green corridors, including 8.1 hectares of ‘new open space’. Curiously, the published figure that should show this breakdown contains no numbers at all. The arithmetic survives only in the figure’s hidden accessibility text — the description read aloud by screen readers. This refers to a quantification table ‘overlaid on the side of the plan’. However, this table was removed before publication, and nobody has updated the hidden text. Our own measurements confirm the totals are correctly computed. So why take the table out?


How big is Sparke Evans Park? Pick a number

The document gives three different sizes for the area’s only existing park, Sparke Evans Park: 2.9 hectares in the body text, 2.5 in the hidden arithmetic, and 2.34 as drawn. The Council’s own GIS records 2.3416 ha. A small thing, perhaps — but the body text overstates the park by 24%, which is the baseline everything else is measured from.

A bigger question is how large is the site itself? The Masterplan never says. Its drawn boundary encloses 94 hectares but the council’s investment website says St Philip’s Marsh totals 65 hectares. Nobody reconciles the two. This is important as the site area is the denominator for the plan’s flagship promise of 25% tree canopy. 25% of which number?


What actually counts as a park?

Bristol’s Parks and Green Spaces Strategy is clear that ‘public realm’ — squares, promenades, landscaped frontages — does not count as open space for recreation. Strip those out of the Masterplan’s 8.1 hectares and the qualifying provision shrinks to somewhere between 5 and 6.6 hectares, most generously counted — and only around 2.6 to 4.3 hectares of it is new. The real new parks are two: Chapel Park (1.26 ha) and Fruit Market Park (about 1.3–1.5 ha). Each is roughly the size of College Green. Between them and Sparke Evans Park, they are expected to host school play, neighbourhood events, ecology, gardens and the daily recreation of thousands.


The density arithmetic nobody has published

Bristol’s adopted standard for the city centre zone is 7.75 m² of recreational open space per person — itself barely a quarter of the 33 m² the average Bristolian enjoys citywide. Working through the strategy’s published figures shows that standard has been set with zero headroom: it assumes the central area’s population will rise 65%, offset by just 2.9 hectares of new green space, landing exactly on the 7.75 m² standard adopted.

The St Philip’s Marsh residents will get roughly 3.3 to 4.4 m² of qualifying green space per person on site, about one tenth of the citywide average. And that’s before you include the daytime population, who will share the same spaces: a workforce of 5,000 or more, several thousand students, and those whom the plan rightly invites in, living nearby in The Dings, Barton Hill, Totterdown and Redcliffe — some of the most green-space-deprived communities in Bristol. If the Masterplan’s population exceeds what the strategy assumed — and its unpublished assumptions are a question we’ve put to the Council — the adopted standard is breached simply by the arithmetic.


Five-minute-walk — from the front door, or the tenth floor?

We modelled walk times over the plan’s own street network. The average journey to the nearest named park is about three minutes. This supports the five-minute-walk promise. However, with roughly one in five residents living above the fifth floor in residential towers of ten storeys and more, this will add to the walk time just getting to the ground before setting off. For those households the five-minute promise quickly becomes longer. Sparke Evans Park, in the south-east of the site, is up to 21 minutes from the far north-west corner, while parts of the employment area are 7–10 minutes from any named park.

And five minutes for whom? The plan’s promise assumes a brisk walker covering 400 metres in five minutes. Bristol’s own parks standard describes that same 400 metres as a nine-minute walk — the pace of older people, small children, anyone with a buggy or those whose walking is impaired: exactly the people who parks matter most for. At that pace, every estimate above roughly doubles, and the far corner of the site is nearly 40 minutes from Sparke Evans Park. The five-minute-walk promise is really a 400-metre promise — which should be judged at the speed of the slowest, not the fastest.


Three thousand trees, ready by the 2050s?

The 25% canopy pledge needs 16–19 hectares of new tree canopy: in the order of 3,000 trees. These will largely be planted on streets that must also fit cycleways, drainage and utilities — creating a near-continuous tree ceiling over two-thirds of the public realm. Newly planted trees would deliver under 1% of site canopy on day one and take 25–40 years to mature, on top of the 20 years needed to complete the development. The 25% canopy pledge currently has no target date, no baseline and no monitoring. So for the first couple of decades, a resident on, say, the tenth floor will look down on saplings, not canopy — exactly what the international 3/30/300 benchmark (3 visible trees, 30% canopy, green space within 300 m) aims to prevent.


What we’re asking for

Our submission makes a series of specific requests, including:

  1. Correct the ambiguous reported park sizes.
  2. Reinstate the vanished quantification table.
  3. State the definitive site area and publish the boundary as open GIS data.
  4. Publish a schedule of open space that distinguishes real recreational space from public realm space, and test this against the projected full daytime population.
  5. Publish the population assumptions behind the quantity standard.
  6. Put a date, baseline, funding and monitoring regime on the canopy pledge.
  7. Front-load tree planting.
  8. Adopt 3/30/300 at design-code stage.
  9. Explain how and when the riverside open spaces will be delivered, given their dependency on the Avon Riversides 2100 flood defence programme — for which £88m has been identified against a further £128m still required.

None of this requires redrawing the plan. It just requires the Partnership to show its workings — because on green space, the difference between a promise and a number is where communities lose out, one planning application at a time.

One last thing. This document was meant to be a Supplementary Planning Document — statutory guidance sitting alongside the Local Plan. A change in Government regulations earlier this year means it will now be adopted only as an “endorsed Masterplan”: non-statutory guidance that developers must merely “have regard to”. That makes everything above more fragile, which is why our submission also asks for the green space framework to be secured through Local Plan policy wording, where it will have legal force.

The consultation closes on 28 July 2026. You can respond through the council’s survey or by emailing: hello@bristoltemplequarter.com — and if green space in this new piece of Bristol matters to you, please do.


Read our submission, with methods and maps, here:

SPM Masterplan Consultation – BTF Response

Analysis for this submission included independent measurement of the Masterplan’s Figure 07.34, georeferenced against Bristol City Council GIS data, and walk-time modelling over the illustrative street network, carried out with AI assistance (Claude, Anthropic) under our direction. Methods are set out in full in the submission’s annex.

The Local Nature Recovery Strategy and Bristol: a reassessment

In January 2025 we argued that the West of England Local Nature Recovery Strategy (LNRS) would do little to improve biodiversity net gain (BNG) in proposed development sites in Bristol. Since then, three things have changed enough to warrant a second look:

A follow-up to our January 2025 post, The Local Nature Recovery Strategy fails to deliver for Bristol.


  1. The emerging Bristol Local Plan has moved to the final stages of the public examination and the timetable for the 2045 Local Plan has been published.
  2. The West of England Mayoral Combined Authority (WECA) has published detailed guidance for developers and ecologists.
  3. We have been able to measure how much of the city the LNRS focus areas cover.

    These three changes mean that the picture is now more nuanced than a simple ‘fails to deliver’, but the practical conclusion is broadly the same. This post sets out why.

    What the latest LNRS has now made explicit

    WECA’s guide for planners, ecologists and developers, together with a dedicated BNG strategic-significance map, now spells out how the 15% Strategic Significance Multiplier uplift is meant to work. To attract the uplift, a proposed intervention must be in a mapped focus area for nature recovery and deliver a measure recommended (mapped) for that location.

    Two points in that guidance are worth dwelling on, because they confirm the argument we made in 2025 — this time in WECA’s own words.

    First, on baseline habitats. Our January post relied on Defra’s position that the multiplier applies only to habitats created or enhanced after development, not to what’s already on site – the baseline habitat. WECA’s FAQ now states this directly: the multiplier ‘is never applied to baseline habitats in the BNG Metric’. That is significant: it means the strategy can never reward the retention of existing habitat on a development site; but only new or enhanced habitats, and then only where a matching measure is mapped.

    Second, on where the mechanism is aimed. The single worked example in WECA’s guide is a developer purchasing off-site BNG units in a focus area. That’s a fair reflection of how the uplift is designed to behave: it’s a tool for steering off-site compensation and habitat banking towards priority locations, not something that typically assists the onsite footprint of a development itself.

    How much of Bristol is a focus area?

    In January we said it was ‘hard to imagine’ the LNRS helping on most Bristol sites, but we did not put a number on the coverage. We have now done so, using WECA’s own published data.

    Taking the Combined Authority’s mapped focus-area layer and clipping it to the official Bristol City Council boundary, 24.2% of the city — roughly 2,640 hectares of its 109 km² — lies within a focus area for nature recovery. (We checked the figure in two independent ways: a regular sampling grid and a random sample of over 90,000 points; both give 24.2%, and the method reproduces the city’s official area to within half a percent.)

    This is not a trivial share; anyone tempted to say the LNRS ‘barely touches’ Bristol should note that nearly a quarter of the city sits inside a focus area. But coverage is the wrong thing to count. That 24.2% is a ceiling — the maximum extent over which the multiplier could ever apply — before two much tighter filters are applied: the habitat being created or enhanced must match a measure mapped for that spot, and none of it can be baseline habitat.

    Coverage is not opportunity

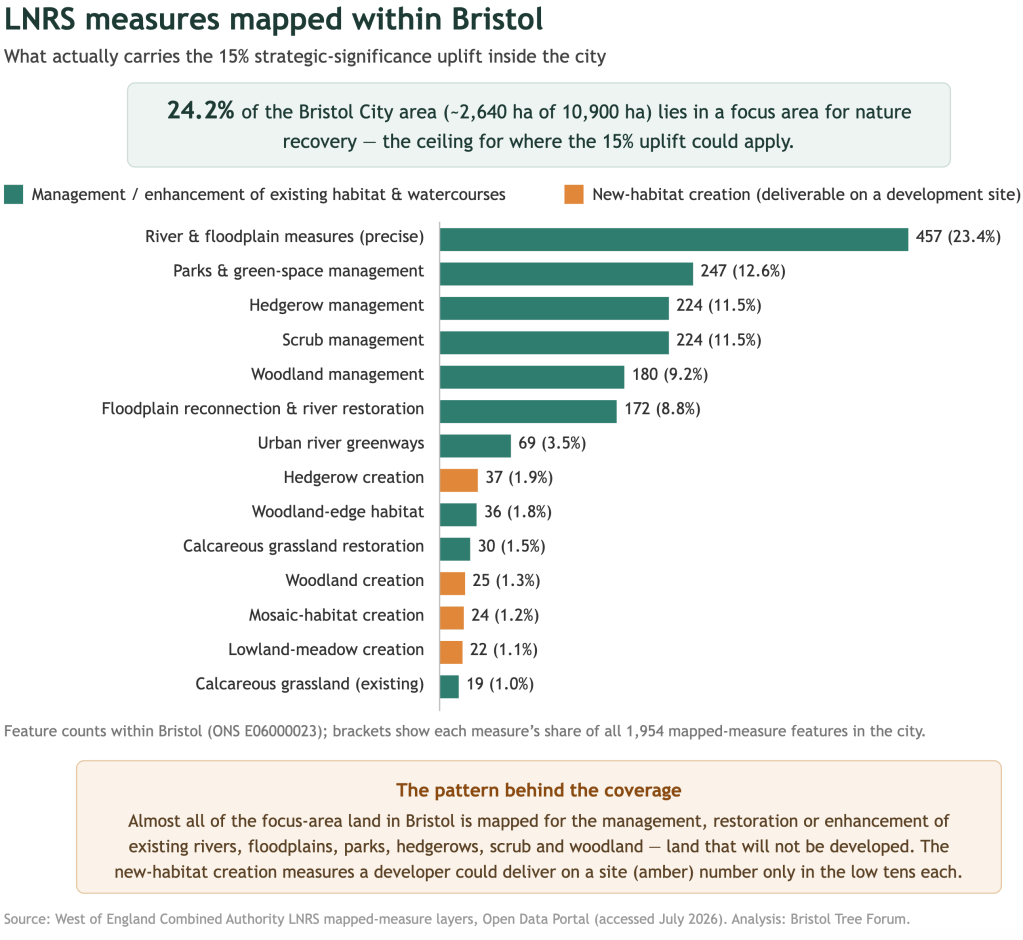
    The more telling question is what is mapped, and where. When we count the individual measures that fall within the Bristol boundary, the focus areas turn out to be almost entirely watercourses and existing public green space that’s unlikely ever to be developed.

    LNRS measures mapped within the Bristol City boundary. Management/enhancement of existing habitat and watercourses (teal) dominates; new-habitat creation measures a developer could deliver on a site (amber) are comparatively few.

    River and floodplain measures dominate, followed by public parks & green space management and hedgerow, scrub and woodland under management. These are overwhelmingly measures for the management, restoration or enhancement of habitat that already exists — mostly along the Avon and Frome corridors, in the city’s parks, and on railway and river margins. This is land that is unlikely ever to be developed and, under the BNG regime, cannot be used to offset on-site habitat losses; BNG offsets may only be provided by registered Biodiversity Gain Sites (BGS). There are six in the LNRS but, currently, none are in Bristol.

    By contrast, the measures a developer might be able to deliver as new habitat on a site — creating woodland, hedgerows, wildflower meadow or mosaic habitat — appear only in the low tens of features and are themselves largely tied to the same green and blue corridors. So, the headline coverage figure and the practical opportunity point in opposite directions: a quarter of the city is mapped, yet the fraction of developable land where a scheme could both sit in a focus area and deliver a matching biodiversity improvement remains very small.

    The planning picture

    The wider planning position has moved on since January 2025, though not in a way that resolves the problem we identified at the time.

    Bristol’s emerging Local Plan completed its examination hearings last year with the final consultation has just completed. We are expecting the inspectors’ final report in the autumn so the plan is not yet adopted and still may not be. In the meantime, the Council having just published the timetable for the 2045 Local Plan which, when it starts this September, will not be completed until April 2029 at the earliest.

    Despite this, the two things we flagged in January still stand. No commitment has yet been made to designate any of Bristol’s focus-area sites — its parks, river corridors and green margins as BGSs available for off-site habitat mitigation — one route by which the uplift could be applied. Central Government has still not issued guidance on the role of the LNRS in planning decisions even though the Levelling-up and Regeneration Act requires plans to ‘take account’ of it. Until that guidance arrives, the strategy’s weight in day-to-day planning remains as defined under the BNG regime.

    Conclusion

    The LNRS is better documented than it was a year ago, and WECA deserves credit for setting out the mechanics clearly. On the specific question we raised in January 2025, that guidance has, if anything, confirmed our reading at the time: the multiplier cannot reward existing habitat. It is built for off-site delivery in priority locations rather than for the sites where most Bristol development happens. As none of these locations in the city are BGS sites, it is practically impossible to apply the 15% uplift they provide.

    The new coverage figure sharpens rather than softens the point. Yes, a quarter of the city is mapped as a focus area — but that land is the Avon, the Frome, in parks or railway land, all of which are already managed and enhanced in place. For a developer weighing up a site in Bristol, the chance that the strategy changes their BNG arithmetic is still low and, where it does, it will usually be through habitat bought outside the city.

    If the LNRS is to deliver the benefits promised for nature in Bristol, the gap is not in the mapping but in the mechanism: making suitable focus-area land available for off-site mitigation, and — as we suggested in January — allowing the city’s own adopted strategies, from its ecological network to its tree and green-space plans, to carry strategic significance where the LNRS does not.

    We suspect that this analysis is also likely to apply to other urban areas across England.


    Our earlier explanation of how strategic significance is assessed is set out in Assessing habitat parcels: strategic significance explained. Coverage and measure figures in this post were derived from the West of England Combined Authority’s LNRS layers on its Open Data Portal, clipped to the Bristol City Council boundary (ONS code E06000023), July 2026.

    Analytical research, policy review and initial drafting were undertaken with the assistance of Claude (Anthropic, 2025). All technical conclusions and professional judgements are those of the author.

    Understanding Biodiversity Gain Plans

    Since BNG became mandatory in February 2024, qualifying developments in England must show how they will deliver at least a 10% gain, to be set out in a Biodiversity Gain Plan (BGP) submitted to the local planning authority. We’ve transcribed 160 BGPs from 21 LPAs into a single, comparable dataset.

    What the data shows so far:

    • Just over under 60% (95 of 160) deliver their gain entirely on site. Another 34 use a mix of on-site and off-site measures, while 17 rely wholly on off-site units and 14 did not state an approach. Two bought Statutory Credits.
    • Off-site reliance is a recurring theme. A number of plans record an on-site biodiversity loss offset by purchased habitat units — a legitimate route, but one that moves the gain away from the community where the development happens.
    • Net gain has to be met habitat type by habitat type (area, hedgerow, watercourse), not as a single blended figure. Several plans that pass overall are marginal — or fall short — on an individual module.

    Accessing this data was harder than it should be:

    • There is no central register of gain plans – why can’t Defra or Natural England include them in their BGS allocation dataset? These documents should be easily accessible.
    • Each council’s portal has to be searched separately, with no consistent way of identifying the relevant application. Only a few authorities (City of York, Bristol and Cotswold among them) have a dedicated application category for BNG discharges. Otherwise the BGPs sit inside generic “discharge of conditions” applications and are very difficult to find.
    • BGPs are produced in a variety of forms – as clean PDFs, fillable forms, bespoke versions or scanned images requiring OCR – which is challenging, especially if they are hand-written.
    • They are often internally inconsistent: off-site figures just copied from the on-site section, credits confused with habitat-bank units, or headline numbers that do not reconcile.
    • Off-site claims frequently differ from what the Biodiversity Gain Sites register records as allocated.
    • Many applications do not include the required BNG Metric calculation.
    • Some applications can’t be analysed because all that is produced (and approved) is the certificate of the off-site HU purchase – and sometimes not even that. As a result, we’ve been unable to include these in our analysis.

    The information exists, but we can only conclude that the planning approval process makes meaningful public scrutiny far harder than it needs to be. Using the available standard Defra form and creating a single searchable register of BGPs would be a straightforward improvement.

    The full dataset and analysis are here — comments, corrections and more data are welcome:

    BGP Full Data Extract

    NB. This analysis will grow as we add more data.

    #BiodiversityNetGain #BNG #BGS #Planning #Nature #Transparency