

The BGS register
The public register of these off-site purchases is called the Biodiversity Gain Sites (BGS) register. It lists both the authority where a development sits and the authority where the compensating habitat is purchased.
We looked at all 2,441 allocations on the register, covering 301 local planning authorities. We found that, across the board, 79% of the allocations send the compensation to a local authority far from the development itself. That is striking enough. But the pattern sharpens dramatically in the more urban areas.
For example, in London, 98% of allocations are delivered outside the borough where the building happens. Just 3% stays within it. London’s boroughs have generated external demand for 46 habitat units and host barely three in return. Metropolitan districts — such as Manchester, Sheffield, Leeds and Birmingham — send 88% of their compensation elsewhere.
By contrast, non-urban authorities send 74%, and keep habitat within their own boundaries in 42% of cases, against London’s 3%.
Taken together, urban authorities are net exporters of habitat. The countryside is where it lands – often in remote rural locations few will ever visit.
How far away does nature go?
The register also records the distance between each development and the habitat bought to compensate for it. The typical distance is 37 km — roughly 23 miles. One allocation in five is more than 100 km away from its development site.
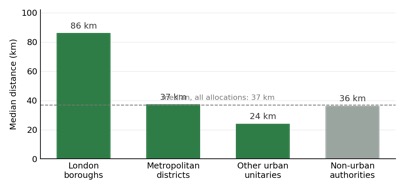
Median distance from development to compensating habitat, by type of authority
For London the median is 86 km, and nearly half of the capital’s allocations are more than 100 km away. Two-thirds fall into the register’s most distant category — the same category the rules are meant to discourage.
Who loses out?
Each site can be placed on a national deprivation scale, from decile 1 (the most deprived tenth of neighbourhoods) to decile 10 (the least deprived). Comparing where a development happens with where its habitat ends up gives a rather uncomfortable picture.
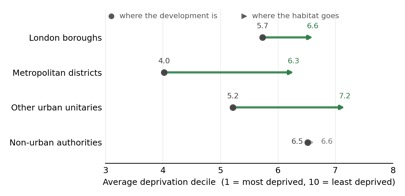
Average deprivation decile of the development, and of the habitat created to compensate for it
Development in metropolitan districts sits, on average, in decile 4.0 — among the more deprived parts of England. The habitat created to compensate for it sits in decile 6.3. Nationally, the shift is from 6.0 to 6.6, and it is almost entirely driven by cities.
Of the 504 allocations where the development is in one of the three most deprived deciles, 99% send their habitat somewhere less deprived — landing, on average, in decile 6.5. For non-urban authorities there is essentially no movement at all.
Displacement, not disappearance — but that is not the whole story
It is worth being careful here. Habitat units are being created. This is displacement, not straightforward destruction, and the register shows real habitat banks being funded and monitored.
Nor is this purely an urban phenomenon. The largest single net exporters on the register are Cherwell in Oxfordshire and Westmorland and Furness — not cities, but high-growth areas under development pressure. Land scarcity, not city status, is the underlying driver.
But displacement still matters, for reasons the metric does not capture. A hectare of habitat in a dense neighbourhood serves thousands of people who can visit it, but the same hectare 50 miles away, on a farm almost nobody visits, scores identically in the register. Access, shade, cooling, birdsong on the way to school — none of these elements appear in the data.
The rules do include a brake: compensation delivered further away is discounted, by a quarter if it’s in a neighbouring area and by half if it’s farther still. On this evidence, though, the brake is not holding, and the latest plans propose to remove it altogether for many developments, making it still worth buying habitat miles away.
What the gain plans show
We also read 205 individual gain plans in detail. The contrast is just as clear on the ground.
Developments in urban authorities lost area habitat on site — down 8% overall between the ‘before’ and ‘after’ figures in their own calculations — while developments in rural authorities gained 16%. Yet both groups have to demonstrate the same 10% or more net gain. Urban schemes get there by buying it: 54% of them use off-site compensation, against 33% elsewhere. Often this is simply because there are just no local Biodiversity Gain Sites, so the developer has no local options.
This is not a story about small development sites. The average development we measured was almost exactly the same size in urban and rural authorities — around 0.7 hectares. It is about the scarcity of available urban land, which is reflected in its cost, not the size of the plots.
The question worth asking
BNG is a real advance on what came before, and the register is a genuine piece of public transparency. This analysis is only possible because the data is published.
But if the policy’s promise is that development leaves nature better off, it is fair to ask: better off for whom? On current evidence, the answer in our biggest cities is someone else, somewhere else — on average 37 kilometres away, in a less deprived place.
Here is our detailed analysis:
Where does the biodiversity go?
Analysis by Bristol Tree Forum, using the Biodiversity Gain Sites register (2,441 allocations to 28 July 2026) and 205 biodiversity gain plans transcribed from local planning authority records. Charts and underlying data at bgs.bristoltrees.space.

 Bristol Tree Forum