Our 2024 tree giveaway – free saplings for planting

Last year we were able to provide – free of charge – over 2,000 tree saplings for tree lovers to plant in and around Bristol…. and beyond!

This year we plan to give away pedunculate oak (Quercus Robur) and downy birch (Betula Pubescens), each native and supporting lots of wildlife.

Would you like some to plant out in 2024? We have 2,000 to give away.

First come, first served, tho!

Stop Press – We have now distributed all available trees, so this offer is now closed. Thanks for all your support.

Watch out for our offer next year!

Few of us will forget that 2023 was the hottest year ever recorded and far exceeded previous temperature records, both locally and nationally, coming close to the average world temperature of 1.5C that we have all been challenged to avoid!

The Met Office reports that in early September 2023, the UK experienced a significant heatwave with daily maximum temperatures exceeding 30°C somewhere in the UK for seven consecutive days from 4th to 10th and reaching 31 to 32°C across south-east England. While this heatwave would not have been particularly unusual had it occurred during the high summer months (July or August), this was, for September, the longest run of days exceeding 30°C on record.

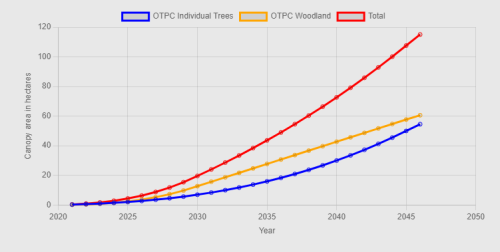
We all know the value of trees in sequestering carbon, and they still represent the most effective and widespread means of removing CO2 from the atmosphere. For instance, a single mature oak tree is the equivalent of 18 tonnes of CO2 or 16 passenger return transatlantic flights. However, it is in our cities that trees provide the greatest benefits; cleaning our air, reducing flooding, improving our physical and mental health, and, crucially, reducing temperatures during heat waves.

Our cities suffer additional problems during heat waves, with all of the concrete and tarmac absorbing a lot of energy from the sun and releasing it as heat. This “heat island” effect can raise temperatures by as much as an additional 12C. Trees can reduce, or even eliminate, this effect, partly through shade but also actively cooling the air by drawing up water from deep underground, which evaporates from the leaves… a process called evapotranspiration. According to the US Department of Agriculture, this cooling effect is the equivalent to 10 room sized air con units. This cooling greatly enhances our resilience to the dangerous heat waves that are predicted to increase in severity and frequency.

Also, Trees improve air quality by absorbing both gaseous (e.g., NO2) and particulate pollution. They reduce traffic noise and flooding and improve physical and mental wellbeing.

Thus, trees are a crucial, but often ignored, element in increasing our resilience to climate change. It is therefore disappointing that neither the council’s Climate Emergency Action Plan or the ‘Adaptation to a changing climate’ section of the recent draft Bristol Local Plan review make any mention of trees.

We are one of the most biodiversity depleted countries in the world, and have lost nearly 70% of our biodiversity since the industrial revolution. Trees are vital in supporting biodiversity, with oak trees capable of supporting over 2,300 different species, including birds, mammals, invertebrates, mosses, lichen and fungi.

What is Bristol Tree Forum doing to help?

It is said that the best time to plant a tree is 20 years ago, and the second best time is now.

As well as advocating the retention of life-saving trees in our city, Bristol Tree Forum have been encouraging tree planting by holding an annual tree giveaway since 2020. In that year we purchased 1,600 oak saplings from Maelor Forest Nurseries which we distributed free of charge. In 2021/2022 we initially gave away 600 white birch and 400 alder, as well as 900 oak saplings, the latter thanks to a partnership with the Arkbound Oakupy project. We were then contacted by the Forest of Avon Trust who had a surplus of 4,500 tree saplings, over 4,000 of which we were able to distribute through our network of tree planters. Overall, that year we gave away around 6,000 trees including 1,600 oak, 740 silver birch, 860 white birch, 55 grey birch, 600 alder, 100 alder buckthorn, 950 rowan, 45 Scots pine, 60 sweet chestnut, 300 sycamore, 50 spindle and 630 wild cherry. Last year, we manage to distribute 2,102 trees.

Trees planted in Bristol. Trees were also planted as far afield as West and North Wales, South Devon and Wiltshire.
Just some of the trees given away in 2021/22

Flushed with the success of last year’s project, we have ordered another two thousand saplings – pedunculate oak (Quercus Robur) and downy birch (Betula Pubescens) – which we are ready to give away. Each species is a native tree of great benefit to wildlife and is tolerant of urban and rural conditions.

Trees can be ordered using the form below

We will get delivery in late February, when the trees can be collected from a site in Redland, Bristol.

The saplings come bare-rooted (i.e. out of the soil) and need to be planted as soon as possible after collection, although the viability of the trees over winter can be extended by storing the trees with the roots covered in damp soil. The form below is to find out who would like to have saplings for planting and how many, and for you to provide basic contact details (email and/or phone number) for us to organise collection of the trees. Contact details will not be used for any other purpose.

Measuring and Modeling the Tree Canopy of Bristol

A new canopy growth model shows the challenge of increasing Bristol’s tree canopy to 24%, an increase of a third.

Launched in January 2019, Bristol’s One City Plan is a vision of the development of Bristol over the years until 2050.  This vision covers many aspects of city life.  Of particular interest to the Bristol Tree Forum are two goals:

by 2036  Tree canopy cover has increased by 25% since 2018

by 2046  Tree canopy cover has doubled since 2018

The obvious question to ask is :

What was the canopy in 2018, the baseline for these proportional increases?

But to answer that question, we need to ask another:

How can tree canopy be measured across the city?

We would expect certain properties of a method of measurement, such as accuracy, precision, repeatability, economy (since it will have to be applied repeatedly over the years to assess progress) and scalabilty (so the method can be applied to any boundary to analyse selected areas of the city). 

Neither question was addressed in One City Plan publications. A group led by BCC’s Richard Ennion which including Forest of Avon Trust (FOAT), Woodland Trust and Bristol Tree Forum (BTF) met in in 2018-2019 to address these and other tree strategy issues. An ecological survey using the i-Tree Eco method was undertaken by FOAT and volunteers (link lost). Here 201 randomly located 11m radius plots are surveyed. This resulted in useful data on the proportion of tree species (Ash was a worrying 16% of trees in Bristol) and estimated the tree canopy at 12%. BTF had also carried out a survey using i-Tree Canopy which is a desk-based method using Google Map imagery able to be carried out by citizen scientists. Our figure was around 18% which was more in line with previous estimates. This figure was later quoted in the Cabot Instutute Review of Progress

Our arguments in favour of the i-Tree Canopy method were several:  reputational (it is used by Forest Research in their nationwide survey); precision (error range is smaller than i-Tree Eco and sample size easily increased to improve precision); economy  (i-Tree Eco survey cost around £20k whereas i-Tree canopy is essential free ) and scalability (the method can be easily applied to any bounded area). 

In the event, the lower figure of 12% was adopted but no decision was made about a suitable method. The 12% figure leads to a goal of 16% by 2036 and 24% by 2046. However, since the i-Tree Eco method was limited to 201 plots across the city, it is unable to give estimates at ward level, so reports about variability by ward have, anomolously, used our i-tree Canopy figures of 9% to 22%. Ward-level estimates are visualized on our ward information page.

image

The i-Tree Canopy method can be undertaken using a tool provided by i-Tree. BTF have developed our own version of this tool to improve the precision, ease of use by citizen scientists and to integrate into our BristolTrees website. We have used this tool to estimate the canopy for 2020 and while there is a slight numerical increase, it is not statistically significant.

More recently we have had access to the estimates produced by the commercial Bluesky tree map which is based on lidar and aerial imagery. The figure for Bristol, (once corrected to exclude large areas of the Severn Estuary in the Bristol Unitary Authority boundary) is slightly less than the i-Tree Canopy estimate, a difference probably accounted for by BlueSky’s ability to exclude canopy below 3m. Recent BCC reports seem to accept that the baseline is 18% and Bluesky mapping recommended as the method of estimation. It is however unclear how the 18% baseline affects the One City Plan goals. If still based on the initial 12% but measured using Bluesky (or i-Tree Canopy), the 2036 goal of 16% has apparently already been achieved!

The use of the commercial Bluesky service raises questions of the cost of this data, its granularity and the extent to which this data will be publicly available as open data.  We look forward to answers on these issues.

Canopy prediction

We have created an online canopy prediction model which computes the canopy over a future period, based on defined planting schemes, which may be so many trees per annum over a period, or so much woodland area.

The BCC report on the planting season 2021-22 shows that 1,352 individual trees and 3 hectares (ha) of woodland were planted.  The model predicts that this would yield a total of about 8 ha canopy by 2046. (The BCC report predicts 22.7 ha but this is when all trees have reached their full maturity, well beyond 2046). If repeated every year till then, this planting programme would produce about 120 ha. This is the model used.

image

To get a fuller picture, we can account for the trees which are lost due to disease, damage or because they outgow the site. On average, about 400 BCC trees are lost each year,and this figure is expected to rise as Ash Dieback takes its toll. If this is added into the model, the result is much less promising. This powerfully demonstates the great benefit of saving the existing tree stock.

image

However it is unfair to account for tree losses in the BCC tree stock without  modeling the canopy growth. This model needs to take account of the age and species profile and to take into account tree management practices. Many large street trees are managed through regular pollarding so that their canopy is essentially constant. This is complex task which is still to be done.

Is the goal achievable?

Achieving the goal of even 24% cover from a base of 18% by 2046 is still a challenging task, even though this would increase tree cover by only a third rather than doubling. It would require adding 660 hectares of tree canopy in 28 years.

paper by Waters and Sinnett (2021) looked at this issue.  Their results are not directly compatible because, thanks to the baseline confusion, they explored the need to increase canopy from 12% to 37.5% using the i-Tree Forecast software. Multiple scenarios are explored but no distinction was made between woodland planting, where the eventual canopy area is limited to the planting area, and planting individual street or park trees able to grow to full canopy width. 

In order to create 660 ha, our model indicates that you would have to plant 26 ha of woodland per annum or 14,000 individual trees or some mixture of the two. This model assumes an annual mortality rate of 1%. With a mortality of 3% more typical of urban trees, the planting rate rises to 24,000 trees pa.  Urban trees have high early mortality which reduces over time and this is not yet modeled.

image

In the predictions above, canopy size prediction uses Root Protection Area as defined in BS5837. RPA is a generous proxy for canopy area. Other predictve models are supported, including one derived from data on the Bristol tree stock. The model takes no account of trees lost through the period due to felling existing trees because of age, disease or development, nor for the effect of climate change on tree health. As a result, these predictions, daunting though they are, are likely to be under-estimates of the planting required to achieve the goal.

However, the major constraint is the lack of suitable street space and land to achieve this level of planting and competition for land use from other One City Plan goals, such as increased housing, food security and greater ecological diversity. Trees alone provide some ecological benefits although this is species-dependant. In general, British native trees provide better ecological support than introduced trees. 37% of the existing council-owned tree stock are natives but only 18% of the trees ear-marked for planting are natives.  Woodland areas have a much higher proportion of natives. BCC is undertaking research into the availablity of both street and parkland planting to explore the opportunities for street and park planting.

So our assessment is that even the goal of 24% is unachievable.  This does not of course mean that we should not do our utmost to increase tree canopy. The benefits of trees in an urban environment are well-documented.

The private realm

This analysis has focused on the role of the council in expanding tree canopy on council land. However the majority of land and hence tree canopy in Bristol is in private and commercial hands. The need for private and commercial landowners to use their land to help move the city forward is clear. BTF is particularly concerned over the loss of mature trees due to housing and other development. Mature trees are an irreplaceable (in the short and medium term) loss of canopy and sequestered Carbon. Likewise for private homes, the trend seems to be in the wrong direction, with paving of front gardens, astroturfing of back gardens and existing trees often deemed more of a nuisance that a benefit. 

The need to bring the public on-side with this goal is urgent.

Bristol’s Tree Canopy

“Bristol ranks as the 5th greyest city in England”

This statement was made in a recent article in Wales Online,  the Express, and elsewhere. The article, with a by-line of Neil Shaw, seems to be based on a press release by OVO Energy who are promoting a petition to create a legally binding target to plant 30,000 ha of new woodland each year to 2050.  The article reported tree cover in a number of countries and cities around the UK based on data supplied by the aerial survey and GIS company BlueSky.  Amongst the results is :

Bristol, known for its green credentials, ranks as the 5th greyest city in England at 8% – and only 1 tree per person. 

This is very different from the estimate produced by our own tools which estimate tree canopy cover (TCC) in 2020 at around 17.5%. Thankfully, as the following analysis discovers, Bristol can hold its head as a green city.

i-Tree Canopy 

Our estimate is based on a desktop survey using a methodology called i-Tree Canopy.   The methodology is pretty simple:  take any boundary, randomly place a number of points within the boundary, examine each point in Google Maps and decide if the point lies within a tree canopy or not; the ratio of canopy points to the total number of points is the TCC, Uncertainty arises from the nature of the random sampling and interpretation of the image, particularly to distinguish a tree from hedges and low ground cover.

Our version of this approach is integrated with the Trees of Bristol website so that it can used to estimate TCC for any area in our database with a known boundary.  In particular, we have used this tool to estimate TCC for all wards in Bristol which are mapped here.  These values have joined the many hundreds of estimates across the UK  to form the GB Ward Canopy Map  organised by Forest Research.  With this pedigree, we have been advocating this approach for use in Bristol as the means to assess progress towards Bristol’s ambitious goal of doubling tree canopy by 2046.  Aggregating the samples across all 32 wards, we estimated that Bristol had 17.9% TCC in 2018 and by 2020 it was  17.5%. (This change from 2018 to 2020 is not statistically significant)

National Tree Map

The estimates in the press article were based on the National Tree Map, a commercial product from Bluesky.  This uses a combination of their own imagery and LIDAR data.  Complex analysis of the LIDAR data, using the difference in return time from ground and canopy reflections enables an estimate of the canopy above 3m high.   

Discussion with Bluesky revealed a probable cause of the discrepancy for Bristol.  Any comparison between estimates needs to be based on the same boundary definition using imagery from the same time period. For the i-Tree Canopy approach we have used the City of Bristol boundary which has an area of about 11,000 hectares (110 sq km) . In contrast, it turns out that  the data provided to OVO energy by Bluesky was based on the Unitary Authority Boundary.  For Bristol this is a rather odd area, taking in a swath of the Bristol Channel down as far as the islands of Flat Holm and Steep Holm.  This is because historically, the boundary of the Port of Bristol is included.

image

The area within this boundary is 23,500 hectares.  Since Bristol can hardly be criticised for failing to plant trees in the Bristol Channel, this dramatically distorts the estimate.  Adjusting for this difference in definition, I arrived at a figure of 17%, within the statistical bounds of the i-Tree canopy estimate.

The National Tree map was also used back in 2014 as reported in the Daily Mail.  The accompanying map similarly shows a very low value for tree canopy in Bristol so I suspect that the same boundary was used there too.

image

Comparison

After discussion with BlueSky, I supplied four boundaries for assessment using the NTM methodology for comparison with the i-Tree approach: the Bristol City Boundary and three wards chosen to have low, medium and high levels of canopy. These are the results:

image

NTM uses a strict height of 3 metres when assessing canopy whereas using i-Tree canopy, the distinction between tree canopy and lower greenery including hedges is assessed visually, so a slight upward bias might be expected and has also been observed in Forest Research data.  On the whole though, this comparison shows very strong agreement between the two methodologies. 

The bad news

The gross error in Bristol’s tree canopy percentage actually made it easy to see that something was amiss.  One must assume that similar issues will have occurred in the case of other cities whose boundaries are subject to debate.  Indeed, the Unitary authority boundary for Portsmouth, which with only 4% cover is reported to the be worst in the UK, includes the expanse of Portsmouth and Langstone Harbours.  According to the Portsmouth Council website, land is about two-thirds of the area of the authority so a better figure would be 6%, still low.

Problems with boundary definitions plague this data.  Bristol City is only the core of the conurbation with large parts of what we think of as Bristol in South Gloucestershire and Bath and North East Somerset.  Comparison with the figure given for Leeds, also 17%, is not possible since the City of Leeds boundary includes all the surrounding towns and countryside.

It is clear that unitary authority boundaries are not directly suitable for urban canopy evaluation.

The need for full data publication

In addition to the 2014 report and the recent publicity by Ovo Energy, another survey by Bluesky was publicised late last year on the BBC but no figure for Bristol is mentioned.  These press articles give only selective figures rather than the full data across England. I searched for published reports containing the full data, which I expected to include the base area, canopy area as well as the computed percentage and rankings.  I found nothing.  This makes it impossible to correct other derived data, such as the ranking of Bristol as the “5th greyest in England”.

I would hope that in future, companies like Bluesky and Ovo Energy will see that making full data openly available in support of extracts and assertions would reduce mis-interpretations, provide a public good and better promote their company.

Journalists too have a responsibility here, not only to critically assess press releases but to request and link to the supporting data. Neither happened in this case.

The good news

This exercise has turned out to be good news for both the National Tree Map methodology and our own work with i-Tree Canopy. The results are very similar and differences are rather consistent and explainable.  Our implementation of i-Tree Canopy is free to use by citizen-scientists with known error bounds and can be quickly applied to any chosen boundary.  With the inclusion of historical imagery from Google Earth, it can also be used to compare canopy over time.  

This exercise has also confirms the doubts we held about the figure from an i-Tree Eco survey carried out in 2018.  This survey used volunteers to ground-survey 200 random plots in Bristol. The survey arrived at a figure of 12% with wide error bounds but much less than the i-Tree Canopy value.  All methods have some uncertainty but we can be pretty confident that Bristol’s Tree Canopy in 2020  is in the region of 17 – 18%.

The National Tree Map is primarily intended as a means to locate and measure the canopy of individual trees in an area.  The canopy estimate is only a by-product and agrees well with the i-Tree canopy approach.  For its primary purpose, NTM appears to provide a very much more economic solution than on the ground surveying.  Indeed it would be very interesting to compare this map for Bristol with the mapping of individual trees in Trees of Bristol.

Forest Research is at the forefront of research into the UK Urban Tree canopy and their 2017 paper on the Canopy Cover of Englands Towns and Cities remains the most authoritative UK -wide survey. We look forward to an update to this excellent work.

Chris Wallace

First published in The Wallace Line on 11 May 2021

London Planes on Narrow Quay

In the early ‘70s, Great Britain was in the throes of the calamitous spread of a new virulent strain of Dutch Elm Disease which would eventually kill nearly all the 25 million mature elm trees and change the face of the English countryside forever.

In the face of this devastation, the government launched  National Tree Planting Year  in 1973, with the slogan ‘Plant a tree in 73′ . The scheme was supported by the Forestry Commission and the Crown Estate who donated thousands of trees which were planted by local authorities, schools, businesses and voluntary organisations.  The Tree Council was established in 1975 to build on the momentum generated by this campaign.

In Bristol, the Civic Society worked closely with the city council and over the following years, 2000 urban trees were planted. One of the architects of this bold urban plan was the council planner Frank Kelf (February 5, 1925 – August 28, 2013) who was instrumental in persuading a cash-strapped council to invest in this major undertaking.

The centre of Bristol post war was a rather neglected space, particularly the dock area.  Narrow Quay runs along the left bank of St Augustines Reach in the heart of the city.

image

Bristol Archives ref 40826/DOC/40:  City Docks: The ‘Rosedene’ at Narrow Quay : 1960

In the 1950s, Bristol’s role as a port was in decline and slowly the cranes and warehouses fell into disuse and many were demolished, leaving a neglected and ill-used post-industrial landscape. The photo shows the quay in 1975.

image

Demarco Digital Archive : Opening of the Arnolfini Art Centre : 1975

An exhibition of “Ideas for Bristol” was run at the Bristol Museum and one idea for planting trees on Narrow Quay was shown from BCC’s Urban Design team.  Peter Floyd was then chairman of the Civic Society as well as having been a city civic planner.  Peter successfully gained the support of the businesses fronting the quay who provided the funds to buy ‘extra heavy standard’ trees able to deter vandalism. This photo by John Trelawny-Ross, city conservation officer, shows these substantial trees in Sept 1978 .

image

Bristol Archives 4512/Of/12/21 : Bordeaux Quay(sic) John Trelawny Ross 1978

Here is the avenue in September 2019 forty years later, with Peter Floyd, recently honoured for this and other contibutions to Bristol.

IMG_20190925_173402266

The trees have grown remarkably well.  With perhaps only one which may be a replacement, all the original trees remain and appear in good health. The chart shows the growth of the trees over about a 7 year period:

image

There is quite a range of girths, perhaps reflecting trauma in early life or differences in the ground in which they are planted.  The average girth of 221 cm would (using our age calculator) suggest an age of 59 years. In fact they were planted about 43 years ago although perhaps already 10 years old when planted.

The avenue is mapped here on BristolTrees

Eastgate woodland

Over the summer, the owners of the Eastgate Retail Park, Consolidated Properties Group, submitted plans for the redevelopment of the east end of the retail park. (170/01580/P)  Currently the area comprises a drive-thru Burger King, a car park in front and an area of woodland behind.

The proposal is to replace the Burger King building with 5 new retail units and move the drive-thru restaurant into the car park. Rear service entrance to the units will be required, necessitating a service road which effectively removes the woodland. Marked for re-development were a fine 120 year-old Oak, protected by a Tree Preservation Order (TPO), overlooking the roundabout and and an area of woodland also protected by a TPO which includes 12 specific trees with an understory of younger trees and bushes.

eastgate_oak
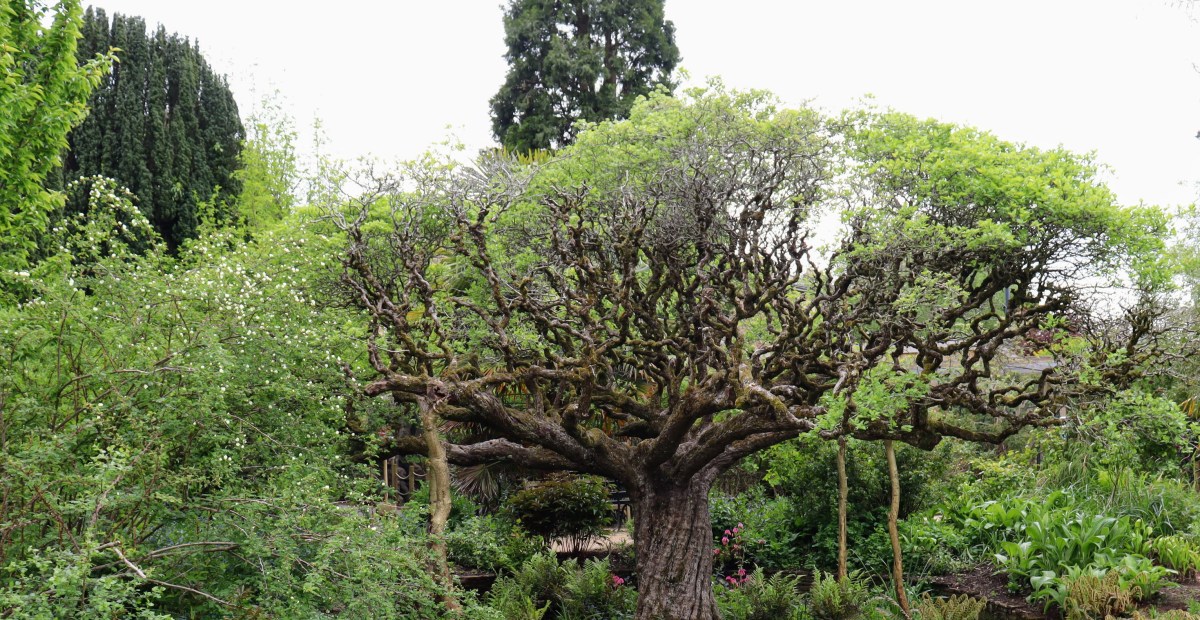
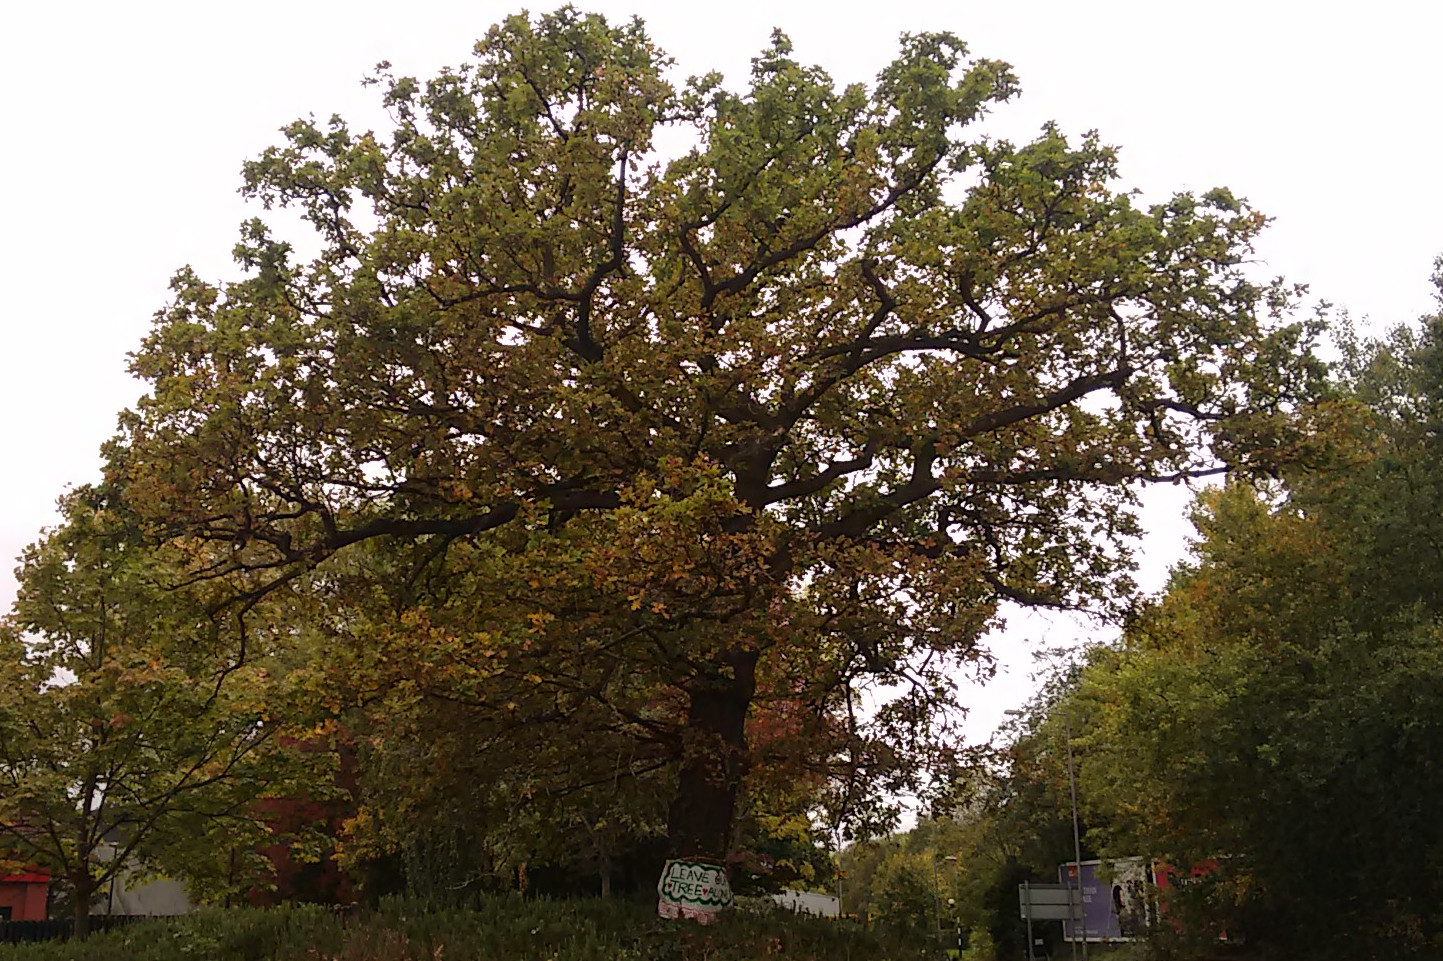
Over summer there was great public outcry about the loss of the prominent oak  (Bristol Tree Forum) and plans were resubmitted which mark the oak, two poplars and an ash for retention, but with no change to the location of the buildings. The woodland area is still destroyed, leaving only three isolated trees from the original canopy and understory.

revised-construction

The aboricultural report produced by Matthew Bennett of the Bristol City Planning Department is very critical of the plans, pointing out that the proposal takes no account of the Bristol core strategy nor of the tree replacement scheme and remarks that “The group of trees are an important green infrastructure asset which has a historical reference and provided a significant visual amenity to an already heavily developed site.”

eastgate-spinney

Consolidated Properties Group  owns over 40 retail parks and retail units throughout the UK, having bought Eastgate in 2011 . The company is one the the richest family-owned businesses in the UK and is chaired by the founder, Peter Stuart Dawson. The company acquired Eastgate in 2011.

Looking at the aerial photographs of retail parks on their website, the absence of green spaces is very striking . Retail parks take up large areas of ground, comprising only buildings and tarmac. Very little land is given to green spaces or exposed ground. Trees where they are planted are largely functional, used for screening purposes.

Isn’t it high time that a significant part of retail parks should be reserved for trees and woodland.  This is after all more in line with the meaning of “park”. If not, then at least we should resist the urge to remove what little woodland does still exist.

Public consultation on the revised proposal is now closed but comments can still be addressed to councillors and officers.

Chris Wallace

17th October 2017