Bristol’s Tree Canopy

“Bristol ranks as the 5th greyest city in England”

This statement was made in a recent article in Wales Online,  the Express, and elsewhere. The article, with a by-line of Neil Shaw, seems to be based on a press release by OVO Energy who are promoting a petition to create a legally binding target to plant 30,000 ha of new woodland each year to 2050.  The article reported tree cover in a number of countries and cities around the UK based on data supplied by the aerial survey and GIS company BlueSky.  Amongst the results is :

Bristol, known for its green credentials, ranks as the 5th greyest city in England at 8% – and only 1 tree per person. 

This is very different from the estimate produced by our own tools which estimate tree canopy cover (TCC) in 2020 at around 17.5%. Thankfully, as the following analysis discovers, Bristol can hold its head as a green city.

i-Tree Canopy 

Our estimate is based on a desktop survey using a methodology called i-Tree Canopy.   The methodology is pretty simple:  take any boundary, randomly place a number of points within the boundary, examine each point in Google Maps and decide if the point lies within a tree canopy or not; the ratio of canopy points to the total number of points is the TCC, Uncertainty arises from the nature of the random sampling and interpretation of the image, particularly to distinguish a tree from hedges and low ground cover.

Our version of this approach is integrated with the Trees of Bristol website so that it can used to estimate TCC for any area in our database with a known boundary.  In particular, we have used this tool to estimate TCC for all wards in Bristol which are mapped here.  These values have joined the many hundreds of estimates across the UK  to form the GB Ward Canopy Map  organised by Forest Research.  With this pedigree, we have been advocating this approach for use in Bristol as the means to assess progress towards Bristol’s ambitious goal of doubling tree canopy by 2046.  Aggregating the samples across all 32 wards, we estimated that Bristol had 17.9% TCC in 2018 and by 2020 it was  17.5%. (This change from 2018 to 2020 is not statistically significant)

National Tree Map

The estimates in the press article were based on the National Tree Map, a commercial product from Bluesky.  This uses a combination of their own imagery and LIDAR data.  Complex analysis of the LIDAR data, using the difference in return time from ground and canopy reflections enables an estimate of the canopy above 3m high.   

Discussion with Bluesky revealed a probable cause of the discrepancy for Bristol.  Any comparison between estimates needs to be based on the same boundary definition using imagery from the same time period. For the i-Tree Canopy approach we have used the City of Bristol boundary which has an area of about 11,000 hectares (110 sq km) . In contrast, it turns out that  the data provided to OVO energy by Bluesky was based on the Unitary Authority Boundary.  For Bristol this is a rather odd area, taking in a swath of the Bristol Channel down as far as the islands of Flat Holm and Steep Holm.  This is because historically, the boundary of the Port of Bristol is included.

image

The area within this boundary is 23,500 hectares.  Since Bristol can hardly be criticised for failing to plant trees in the Bristol Channel, this dramatically distorts the estimate.  Adjusting for this difference in definition, I arrived at a figure of 17%, within the statistical bounds of the i-Tree canopy estimate.

The National Tree map was also used back in 2014 as reported in the Daily Mail.  The accompanying map similarly shows a very low value for tree canopy in Bristol so I suspect that the same boundary was used there too.

image

Comparison

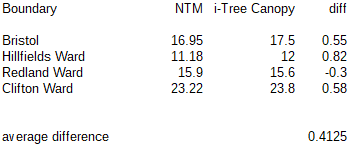
After discussion with BlueSky, I supplied four boundaries for assessment using the NTM methodology for comparison with the i-Tree approach: the Bristol City Boundary and three wards chosen to have low, medium and high levels of canopy. These are the results:
image

NTM uses a strict height of 3 metres when assessing canopy whereas using i-Tree canopy, the distinction between tree canopy and lower greenery including hedges is assessed visually, so a slight upward bias might be expected and has also been observed in Forest Research data.  On the whole though, this comparison shows very strong agreement between the two methodologies. 

The bad news

The gross error in Bristol’s tree canopy percentage actually made it easy to see that something was amiss.  One must assume that similar issues will have occurred in the case of other cities whose boundaries are subject to debate.  Indeed, the Unitary authority boundary for Portsmouth, which with only 4% cover is reported to the be worst in the UK, includes the expanse of Portsmouth and Langstone Harbours.  According to the Portsmouth Council website, land is about two-thirds of the area of the authority so a better figure would be 6%, still low.

Problems with boundary definitions plague this data.  Bristol City is only the core of the conurbation with large parts of what we think of as Bristol in South Gloucestershire and Bath and North East Somerset.  Comparison with the figure given for Leeds, also 17%, is not possible since the City of Leeds boundary includes all the surrounding towns and countryside.

It is clear that unitary authority boundaries are not directly suitable for urban canopy evaluation.

The need for full data publication

In addition to the 2014 report and the recent publicity by Ovo Energy, another survey by Bluesky was publicised late last year on the BBC but no figure for Bristol is mentioned.  These press articles give only selective figures rather than the full data across England. I searched for published reports containing the full data, which I expected to include the base area, canopy area as well as the computed percentage and rankings.  I found nothing.  This makes it impossible to correct other derived data, such as the ranking of Bristol as the “5th greyest in England”.

I would hope that in future, companies like Bluesky and Ovo Energy will see that making full data openly available in support of extracts and assertions would reduce mis-interpretations, provide a public good and better promote their company.

Journalists too have a responsibility here, not only to critically assess press releases but to request and link to the supporting data. Neither happened in this case.

The good news

This exercise has turned out to be good news for both the National Tree Map methodology and our own work with i-Tree Canopy. The results are very similar and differences are rather consistent and explainable.  Our implementation of i-Tree Canopy is free to use by citizen-scientists with known error bounds and can be quickly applied to any chosen boundary.  With the inclusion of historical imagery from Google Earth, it can also be used to compare canopy over time.  

This exercise has also confirms the doubts we held about the figure from an i-Tree Eco survey carried out in 2018.  This survey used volunteers to ground-survey 200 random plots in Bristol. The survey arrived at a figure of 12% with wide error bounds but much less than the i-Tree Canopy value.  All methods have some uncertainty but we can be pretty confident that Bristol’s Tree Canopy in 2020  is in the region of 17 – 18%.

The National Tree Map is primarily intended as a means to locate and measure the canopy of individual trees in an area.  The canopy estimate is only a by-product and agrees well with the i-Tree canopy approach.  For its primary purpose, NTM appears to provide a very much more economic solution than on the ground surveying.  Indeed it would be very interesting to compare this map for Bristol with the mapping of individual trees in Trees of Bristol.

Forest Research is at the forefront of research into the UK Urban Tree canopy and their 2017 paper on the Canopy Cover of Englands Towns and Cities remains the most authoritative UK -wide survey. We look forward to an update to this excellent work.

Chris Wallace

First published in The Wallace Line on 11 May 2021

Bristol Tree Forum tree planting campaign – free Oak saplings available for planting

STOP PRESS

We delighted to report that nearly 1,600 tree orders have been received. We have bought another 600 trees to cover the extra orders and expect delivery soon.

Many thanks to all of you who have placed an order. We shall soon let you know when and where you can collect your trees.

Due to COVID-19 restrictions and delays in government funding, there has been postponements and cancellations of many major tree planting projects. As a result, large numbers of tree saplings are due for destruction in tree nurseries. This includes 750,000 two year old English oak tree saplings at the Maelor Forest Nursery in Wrexham.

Rather than see these trees destroyed, Bristol Tree Forum has purchased 1,000 of the oak saplings for free distribution to anyone able to plant them, whether this is one tree or a hundred.

We will get delivery early in November. The trees can be collected from a site in Redland, Bristol and a few collection dates will be organised hopefully to suit all. They should be planted as soon as possible afterwards.

The saplings are between 10cm and 90cm high. They come bare-rooted (i.e. out of the soil) and need to be planted as soon as possible after collection, although the viability of the trees over winter can be extended a little by storing the trees with the roots covered in damp soil.

This form is to find out who would like to have saplings for planting and how many, and for you to provide basic contact details (email and/or phone number) for us to organise collection of the trees. Contact details will not be used for any other purpose.

Why plant a tree?

A single mature oak tree is the equivalent of 18 tonnes of CO2 or 16 passenger return transatlantic flights.

Despite advances in carbon capture technology, the most efficient and cost-effective way to sequester carbon from the atmosphere is to plant trees.

Recent scientific reports calculate that planting trees wherever we can, without occupying land used for other purposes, would absorb up to two thirds of the carbon emitted in the last century.

Oak trees can support over 2300 different species, including birds, mammals, invertebrates, mosses, lichen and fungi.

Trees improve air quality by absorbing both gaseous (e.g. NO2) and particulate pollution.

Trees reduce traffic noise and flooding, reduce excessive heat in cities and improve physical and mental wellbeing.

Trees valued at over £4.6m are under threat at Bonnington Walk, Lockleaze

Whatever the merits of this application of achieving its primary goal to provide much needed housing may be, it should not be permitted to proceed unless and until it has properly addressed how it will replace and build upon the Green Infrastructure (including trees) that will inevitably be lost if this application proceeds as presently formulated.

Summary of our submission

We object to this application for the following reasons.

Bristol City Council has:

Declared climate and environmental emergencies.

Committed to becoming carbon neutral by 2030.

Committed to doubling tree canopy cover by 2046.

As currently formulated, these plans to build new houses can only set back the work needed to resolve these emergencies and achieve these commitments.

  1. The need to build housing to meet sustainable economic or social development objectives should not be allowed to take precedence over ensuring that the development is also both environmentally sustainable and meets Net Gain objectives.
  2. Whatever the merits of this application of achieving its primary goal to provide much needed housing may be, it should not be permitted to proceed unless and until it has properly addressed how it will replace and build upon the Green Infrastructure (including trees) that will inevitably be lost if this application proceeds as presently formulated.
  3. The existing trees have a significant asset value which should not lightly be ignored. Using CAVAT, we have valued them at £4,674,918.
  4. Under the Mitigation Hierarchy, trees should not be removed unless there is no realistic alternative. One alternative would be to build around the trees rather than remove them.
  5. BCS9 of the Core Strategy also states that “Individual green assets should be retained wherever possible and integrated into new development”. Clear felling nearly all the trees to the east of the cycle/footpath should not, as it so often is, be the default option.
  6. Trees should not be removed merely because they are diseased or self-sown, or because they are small or not perfect specimens of their species.
  7. The removal of existing trees inevitably means that the eco-services they provided will not be replaced for decades, if at all.
  8. The adverse knock-on environmental impact on biodiversity of removing existing trees far outweighs any short-term benefits achieved by replacing them.

Our submission

The planning background

The National Planning Policy Framework

The National Planning Policy Framework (NPPF) seeks to ensure that new development is sustainable. It stresses the importance of Green Infrastructure as one of three overarching, interdependent objectives – economic, social, and environmental. This means that the presumption in favour of sustainable environmental development is just as important as any in respect of economic or social development objectives.

Trees are an integral part of this because of the importance of trees in relation to the management of air, soil and water quality along with other associated ecosystem services, climate change adaptions and beneficial health effects. The NPPF also seeks to achieve the protection and enhancement of landscapes and achieve Net Gain in biodiversity.

The Natural England Joint Publication JP029 – Biodiversity Metric 2.0 (BDM2) provides a way of measuring and accounting for biodiversity losses and gains resulting from development or land management change. It defines Net Gain as an:

“approach to development that aims to leave the natural environment in a measurably better state than beforehand. This means protecting existing habitats and ensuring that lost or degraded environmental features are compensated for by restoring or creating environmental features that are of greater value to wildlife and people. It does not change the fact that losses should be avoided where possible, a key part of adhering to a core environmental planning principle called the mitigation hierarchy.”

The Mitigation Hierarchy

Avoid – Where possible habitat damage should be avoided.

Minimise – Where possible habitat damage and loss should be minimised.

Remediate – Where possible any damage or lost habitat should be restored.

Compensate – As a last resort, damaged or lost habitat should be compensated for.

This is a cascading decision process – only if the preceding choice is unavailable is the next considered.

Local Planning Authorities (LPA) in the UK have a statutory duty to consider both the protection and planting of trees when considering planning applications. The potential impact of development on all trees is therefore a material consideration. In particular, BCS9 of the Core Strategy states that “Individual green assets should be retained wherever possible and integrated into new development”.

We have summarised Bristol’s planning policies as they relate to trees here – Planning obligations in relation to trees in Bristol.

Summary of the proposal in relation to trees

This site covers just over six hectares. The Lockleaze Allotments (a 0.8 hectare Statutory Allotment[1]) is located to the south east of the widest part of the site. It appears to be disused. Most of the substantial trees growing on the site are growing in or around this allotment or to the north of it. We have calculated that, taken together, they cover at least 1.3 hectares of the site – a tree canopy cover (TCC) of around 20% which is well above the estimated TCC for Bristol as a whole which is just under 12%.

All our calculations, summarised below, can be examined in this linked spreadsheet.

The Arboricultural Impact Assessment Report (the AIS) dated June 2020 (based on a survey done on the 19th and 20th of September 2019) identified a combined total of 58 individual trees and 40 tree group features. The number of trees in each group is not given, so it is not possible to say how many trees in total are growing on the site.

Of all the trees growing on site 24 individual and at least 251 group trees are identified for removal. The trees growing in Groups G69 and G74 are all to be removed, but the number of trees in each group is not identified so we have not been able to include or count these in our calculations.

The only reason for given for felling these two groups is because they show evidence of Ash Dieback (Hymenoscyphus fraxineus). As the AIS recognises, the mere presence of Ash Dieback is not a sufficient reason for the removal of a tree. We oppose the removal of these tree unless it can be shown that they there is a better reason for their removal.

The CAVAT calculation

Using CAVAT we have calculated that those identified trees which have a measured stem Diameter (DBH) are worth £4,674,918.  As the AIS fails to give the upper life expectancy ranges[2] of the majority of trees, we have assumed that all those trees given a 10+ or 20+ years life expectancy will survive between 40 and 80 years. This attracts a 5% discount on the base valuation. We have applied a CTI factor for Bristol of 150[3]. All the other factors are set to their default values.

The BTRS calculation

These two tree groups and five individual trees are categorised as Category ‘U’ trees under BS5837:2012 Trees in relation to design demolition and construction, and so have not been taken into account for the purpose of the Bristol Tree Replacement Standard (BTRS) calculation. A further 10 trees are also excluded from the BTRS calculation because their stem diameters are under 15 cm. We advocate that all trees identified for removal should be replaced no matter what their size.

Notwithstanding this and based on the current guidance, we have calculated the BTRS value at 455 trees as per the AIS calculation.

Net Gain calculation

No Net Gain calculation has been undertaken using BDM2 in support of this application.

We have undertaken our own BDM2 calculation in respect of just the trees surveyed in support of this application. A full calculation needs to be undertaken in respect of the whole of the site. This will inform any future decision about achieving Net Gain if this development is to be allowed to proceed.

Using BDM2, we have calculated that the combined tree canopy cover[4] of just the known, measured trees is 1.21 hectares. We have set the A-1 Site Habitat Baseline Habitat Type to Urban – Street Tree in the calculation. This assumes, amongst other things, that any replacement trees will reach maturity in 27 years and so uses a multiplier of 0.3822 to reflect this.

This gives Base Habitat Units of 5.864 and a Base Replacement value of 3.17 hectares. If we add an arbitrary Net Gain value of 10%[5], then the Base Habitat Units increases to 6.451 and the Base Replacement value to 3.49 hectares. Assuming that a 27-year-old tree has a canopy of .00403 hectares, then 866 replacement trees are needed to replace what has been removed and to achieve Net Gain.

Loss of the ecosystem services of trees

We invite you to consider the decades-long damage that felling just one tree (let alone over 277 trees) will cause by inputting the DBH of any tree identified for removal into our Tree CO2 Calculator.

As you will see, when an equivalent tree is replaced on a one-for-one basis, the lost CO2e is never recovered. Even when the largest tree (with a DBH of 100 cm) is replaced with eight trees in accordance with BTRS, it will still take some 40 years to recover the 10.4 tonnes of lost CO2e. And this is just one of the eco-services that trees provide us!

Impact on wildlife from tree loss

We endorse the following passages from the Bonnington Walk Breeding Bird Survey Report which observes at 5.2 Habitat Loss:

The Proposed Development will include the loss of scrub, trees and buildings which provide habitat for breeding birds. The extent of habitat loss is likely to include all the scrub and trees in the centre of the Site with some edge habitat along the boundaries retained…The loss of this habitat will have an impact on any birds using it for foraging or breeding at the time. The Site is located within an urban landscape with limited natural habitats. Alternative habitats are not readily available adjacent to the Site, though alternative habitat is available in the wider landscape including Stoke Park Estate and connected habitats further east. Habitat loss on Site will have an impact at a Local level by reducing breeding bird habitat in the local area…

and at 6.2.1 Habitat Loss:

Where possible, habitat loss should be avoided, and natural habitats retained. Scrub and trees are of most value to breeding birds at this Site. When natural habitats are retained these should be protected during construction to prevent damage including root compaction and knocking off or damaging over hanging limbs.

This is just one example of the likely adverse impact on wildlife resulting from these tree removal plans. There is evidence of a diverse range of both flora and fauna that likewise will also be adversely affected by the loss of these trees.

The Bristol Tree ForumJuly 2020

You can find more detail about the application here:

20/02523/FB – Land on south side of Bonnington Walk, Bristol


[1] Owned by BCC under its asset number 8397.

[2] CAVAT uses six age ranges to set the discount factor.

[3] Bristol has a population of 459,300 and a land area (as opposed to the Administrative area which covers large parts of the River Avon and coastal margins) of 10,970 hectares. Using this gives a population per hectare of 41.9 (459,300/10,970) and so a CTI Index value of 150.

[4] Under BDM2 each tree’s Root Protection Area (RPA) is calculated at 12 times its stem diameter. RPA is roughly equivalent to a tree’s canopy.

[5] The choice is arbitrary chosen only for the sake of illustration. We are not advocating a Net Gain of 10%, though the concept of Net Gain implies an improvement on the base values.

A letter to our Councillors

Dear Bristol City Councillors,

We recognise the fundamental importance of the natural environment, the value that nature has in an urban setting and the global threat posed by the ongoing climate catastrophe. We also recognise that trees are a crucial component in all these concerns.

We are supportive of Bristol City Council’s declaration of a Climate Emergency and an Ecological Emergency and the goals detailed in the One City Climate Strategy, including the commitment to carbon neutrality by 2030 and doubling the abundance of wildlife by 2050. We are also supportive of their commitment to doubling the tree canopy by 2046.

However, we have a real concern that the commendable words are not being matched by effective actions.

A principle aim of the BTF is to promote the planting and preservation of trees in Bristol for the well-being of its citizens, the sustainability of urban habitation, the enhancement of nature in the cityscape and as our contribution to combating climate change (see A Manifesto for protecting Bristol’s existing Urban Forest).

A recurrent concern we have is the continued loss of trees as a result of environmentally insensitive developments that are not sympathetic to the City’s declared commitments outlined above. On the other hand, the BTF supports developments that favour a sustainable environment over high density occupancy, and those that prioritise retention of existing trees.

Bristol’s policy on replacing trees lost to development – adhering to the Bristol Tree Replacement Standard (BTRS) – is widely well regarded. As such, decision makers believe that tree loss is mitigated by subsequent tree replacement. However, recent studies undertaken by the BTF have shown that this is not the case over the timescales committed to by Bristol City Council and the Green Party.

Typically, tree planting undertaken under the BTRS takes between 30 and 50 years to recover the biomass (and therefore the CO2e) lost by felling, well beyond the 10-year commitment on carbon neutrality, and even beyond dates set for doubling the tree canopy or doubling wildlife abundance.

The BTF study has been developed into a versatile online tool for calculating the extent and timescale of the carbon deficit, with a wide range of inputs. This can be accessed via the link Tree Carbon Calculator, and we encourage you to try this yourself. See also the BTF blog Tree replacement and carbon neutrality.

In the example shown here, a mature tree felled in 2020 is replaced by four trees (as per BTRS) of the same species. The carbon released (2 tonnes CO2e) is not recovered until 2064, a full 34 years beyond the date Bristol aims to be carbon neutral.

This model can also be used to determine how many replacement trees are needed to recover lost carbon within a particular timescale. In the example shown, to be carbon neutral by 2030, a reasonable expectation as this is the declared aim of BCC, the felled tree would need to be replaced by 37 plantings of the same species. Scaled up to, for instance, 500 trees, new plantings would need to number 18,500 to mitigate the lost carbon.

This new information represents a fundamental change in the evidence base for tree replacements, and emphasises the need to retain existing mature trees, and not to consider replacement by new plantings as adequate mitigation.

We request that you consider this new information with urgency and make a commitment to oppose developments where mature trees are removed and tree replacements do not deliver carbon neutrality by 2030.

Tree replacement and carbon neutrality

The UK aims to be carbon neutral by 2050. Bristol is more ambitious and aims to reach that goal in 2030. Both are massive challenges in which trees have been enrolled to play their part in mitigating the carbon dioxide (CO2) created by human activity.

Background

There are plans for extensive tree-planting.  The government pledged to plant 30 million trees a year, nationally. This a huge challenge partly because seedlings and land has to be found for these trees. However even when planted, these trees will take a long time to grow and extract CO2 from the air.  We in Bristol Tree Forum are concerned that not enough attention is given to the role of existing mature trees.  

Trees grow and add to their mass each year. Most of this mass is in the form of cellulose and lignin and about 50% of those organic compounds is carbon, obtained through photosynthesis using the energy of sunlight and CO2 from the atmosphere.  The rate at which mass is accumulated increases with age so whilst a 10 year old tree might put on a few kilograms a year, a 50 year old tree might add 50 kg.  So the older the tree the better for CO2 fixation. However mature trees are constantly under threat – from development for housing and industry, from home owners overshaded by large trees, from councils assessing maintenance costs and risks.

Here in Bristol, the Bristol Tree Replacement Standard (BTRS) is part of local planning regulations and specifies how many replacement trees are needed to be paid for by the developer and planted to mitigate the loss of mature trees. The BTRS is a very welcome and forward-thinking strategy, but is it enough to support the Carbon Neutrality goals? Should BTRS  apply also to council-owned and indeed privately owned trees for which no funded replacements are available?

The Bottom Line

In an attempt to understand how this standard works in practice, we have developed an on-line calculator to explore different scenarios.

Tree CO2 Calculator

The general conclusion from this analysis is stark:  it will take 25 to 40 years before the replacement trees are able to compensate for the loss of the mature tree.

The graph shows the scenario of the replacement of a mature tree such as a Maple with a diameter of 60 cm by the 6 trees as determined by BTRS which are faster growing but shorter lived such as Rowens.

Assuming that the original tree is felled, chipped and used as fuel in a biomass boiler (the practice in Bristol), the carbon stored in the mature tree is returned to the atmosphere within months of felling.  The replacement trees start to grow, but absorb much less carbon than the original mature tree would have done, so they take many years to catch up. In the case shown in the graph, it takes 35 years (ie, to 2055) before the new trees mitigate the loss of the original tree.

Modelling

A model of this scenario needs to take into account:

  • the rate at which different species of tree grow at different ages in different conditions.
  • the estimated mortality of the tree over time.
  • the calculation of a tree’s biomass from its girth for different species.
  • the relationship between the tree’s biomass and the amount of carbon stored.

There is a lot of uncertainly in these relationships, partly because of the paucity of data on urban, as opposed to forest, trees. Urban trees are under threat not only from natural processes and disease, but also from the vagaries of vehicles and humans. Planting sites are often less than optimal and urban trees have no support from the ‘wood wide web’.

The interactive calculator allows the user to vary the parameters of the model using the sliders. This allows the sensitivity of the overall outcome to variation in values to be tested. Different policy choices can also be explored and can be used in a predictive sense to determine the number of replacements needed to achieve a given carbon neutral date.

Summary

Documentation on the website explains the thinking behind the model in more detail, and the sources of data used. The model is still under development, in particular to make it easier to select conditions for different species and situations, and to improve the quality of the model itself. The research literature is extensive but often of limited applicability to urban conditions.

We would be grateful to receive additional or better sources of this information, and indeed any comments on the model itself at co2@bristoltrees.space.

Chris Wallace, Bristol Tree Forum

In Defence of Dead Wood

It was once believed that when a tree died, it was no longer of use. For decades, we have actively removed trees at the first signs of rot or fungal attack, felling them at the base and removing all evidence of their existence…

Our guest editor, Nick Gates, Naturalist, writes

Storm damaged trees are hastily sectioned for firewood or bio-fuel. Sometimes, we replace them with a new, younger version of themselves. It was thought that this in turn kept other trees healthy, and that the wider environment benefited as a result.

The fall of a tree opens up new opportunities…

But nothing is further from the truth. By removing this deadwood, we are stripping out a most vital layer of the natural world. Because when a tree dies, it isn’t actually dead.

As a tree grows, its core begins to die. Have you ever looked at a majestic old oak, its core completely hollowed out, and wondered how on earth it was still producing green leaves and fresh shoots? The reason is that only the outer layers of the wood, just below the bark, are alive. They transport all the water and nutrients that a tree needs to survive. Simultaneously, under the soil, a massive network of fungi around its roots help the tree collect all of the vital nutrients and minerals it needs. As the tree grows, the wood core, the growth rings left behind and superseded from previous season, slowly dies.

Left to fade away…

Over time, this core wood is slowly broken down by fungi. In the very oldest trees, the core is lost completely. Perhaps the most famous of these wood-feeding specialists is one you may well have eaten, the Shiitake mushroom. The fungi in turn are eaten by many species, from bacteria to nematodes, insects to mammals, whilst the rotten wood supports many more. Therefore, this soft rotting deadwood actually hosts a complex living food web.

St Andrews Park – The fallen Black Poplar

An oak tree supports over 350 different varieties of insect. But over half of these feed on dead parts of the oak tree.  Bats rely on deadwood cavities to roost, whilst feeding on many species of night-flying beetle that feed solely on deadwood. Redstarts require hidden cavities to nest, whilst searching for bark beetles and moths that grew up in the deadwood. Everything from blue tits to woodpeckers and wood mice to tawny owls rely on deadwood for some part of their existence. By the time an old tree falls completely, upended from its rotting root network, the wood may be dead but the vast diversity of creatures it is feeding are very much alive. 

When we strip out deadwood from a natural environment, often under an aesthetic tidiness premise, we aren’t just taking the wood away. We are slowly eroding the complex living food web that the deadwood feeds. The Bristol Downs has suffered from this for many years. We could have hedgehogs snaffling snails from deadwood retreats and spotted flycatchers nesting amongst the craggy cavities in gnarled out stumps. Animals just need food and shelter to thrive. By removing deadwood, we take away both. There are many ways of leaving deadwood that look aesthetic whilst appreciating the enormous ecosystem service it provides. Good signage can help explain this.

In a time of unprecedented ecological collapse, we must all do what we can to help the natural world. Leaving deadwood in situ is one of the easiest ways to do this. So please, next time you see a fallen tree, don’t look on it as an untidy addition to the landscape, but enjoy it as the next opportunity for nature to reclaim a part in our everyday lives.

@NTGates Feb. 2020

A Manifesto for protecting Bristol’s existing Urban Forest

We invite all candidates standing in this May’s Mayoral and Councillor elections to endorse our tree manifesto which we set out here.

Bristol has declared a climate and ecological emergency. An emergency means making radical changes now – in every council department, by every developer, and by all those who own or care for trees.

All these proposals fit under Bristol’s existing 2011 Bristol Development Framework Core Strategy – BCS9 Green Infrastructure Policy which should now be implemented.  We must stop the needless destruction of so many trees in our city and instead learn to work around and with them.

Everyone from all sides of the political spectrum is talking about planting trees.  We fully endorse this, but it will take time for these new trees to mature. In the meantime, retaining existing trees will have the biggest immediate effect.

We propose that

  • There needs to be genuine community engagement in Bristol’s tree management decisions.  The council needs to listen to communities that want to save trees, not just to those who want to remove them.
  • Urban trees (planted or self-sown) have a tough life. Many bear the wounds and scars of previous damage or interventions.  These trees, though they may not be perfect, should be valued for the ecosystem services they provide and retained with appropriate and careful management wherever possible.
  • Alternatives to felling must be given priority, whether for street trees, or for those threatened by planning applications, or for other trees in the public or the private space.  
  • We need to strengthen planning policies to help retain trees on development sites by building around them, especially when the trees are on the edge of the site. 
  • Veteran and ancient trees require specialist management to ensure their retention whenever possible.
  • When surveys identify trees that present a risk, there should be consultation about the range of options available to mitigate the risk. This should always balance risk with the benefits the tree provides. Felling is only ever a last resort.
  • If trees must be felled, then more trees need to be planted to replace them. This should be based on well-established metrics used to calculate how to increase (not just replace) the natural capital of the lost tree.

Click here to print a copy of the manifesto. Candidates are welcome to download and use to support our aims.

Our Blogs contain many examples of the sorts of issues that have caused us to write this manifesto.